Optimization of codon usage of poxvirus genes allows for improved transient expression in mammalian cells - PubMed (original) (raw)
Optimization of codon usage of poxvirus genes allows for improved transient expression in mammalian cells
John W Barrett et al. Virus Genes. 2006 Aug.
Abstract
Transient expression of viral genes from certain poxviruses in uninfected mammalian cells can sometimes be unexpectedly inefficient. The reasons for poor expression levels can be due to a number of features of the gene cassette, such as cryptic splice sites, polymerase II termination sequences or motifs that lead to mRNA instability. Here we suggest that in some cases the problem of low protein expression in transfected mammalian cells may be due to inefficient codon usage. We have observed that for many poxvirus genes from the yatapoxvirus genus this deficiency can be overcome by synthesis of the gene with codon sequences optimized for expression in primate cells. This led us to examine colon usage across 2-dozen sequenced members of the Poxviridae. We conclude that codon usage is surprisingly divergent across the different Poxviridae genera but is much more conserved within a single genus. Thus, Poxviridae genera can be divided into distinct groups based on their observed codon bias. When viewed in this context, successful transient expression of transfected poxvirus genes in uninfected mammalian cells can be more accurately predicted based on codon bias. As a corollary, for specific poxvirus genes with less favorable codon usage, codon optimization can result in profoundly increased transient expression levels following transfection of uninfected mammalian cell lines.
Figures
Fig. 1
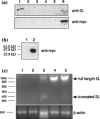
Expression of native and codon optimized T2L. (a) top panel. Comparison of TPV2L expression by immunoblotting with anti-2L [5]. Lane 1 represents supernatant from TPV infected OMK cells [8] collected 48 hpi. Lane 2 is uninfected control supernatant. Lanes 3–6 are supernatants collected from transfected COS7 cells. Lane 3 is transfection control with pcDNA3.1 M/H vector alone. Lane 4 is pcDNA3.1 M/H + native T2L. Lane 5 is pcDNA3.1 M/H + T2L following correction of the predicted splice sites and Lane 6 is pcDNA3.1 M/H + optimized T2L. Bottom panel are the same samples detected following immunoblotting with anti-myc (1:5,000). All supernatant were collected 48 h post transfection. (b) Detection of T2L from Sf-21 cell supernatants following infection by AcNPV control (lane 1) or AcT2L (lane 2) and detected with anti-myc (1:5,000). Markers indicate protein mass in kilodaltons (kD). (c) top panel. RT-PCR of total RNA from untransfected COS7 cells (lane 1), or COS7 cells transfected with the empty vector (lane 2), pcDNA3.1 M/H + native T2L (lane 3), pcDNA3.1 M/H + corrected T2L (lane 4) or pcDNA3.1 M/H + optimized T2L (lane 5). Bottom panel. β-Actin control samples. The ladder indicates DNA sizes in base pairs
Fig. 2
Codon optimization of T2L. (a) Cartoon of the fusion of T2L with the myc/his epitopes. The numbers above the cartoon indicate the nucleotide position. The numbers below the cartoon indicate the amino acid number. (b) The nucleotide sequence of the native T2L gene (2L) is aligned to the optimized version of the gene (opti-T2L). Identical nucleotides are shaded and boxed. Above the native T2L sequence, in bold text, are the 17 nucleotides that were altered by site directed mutagenesis to alter the cryptic splice sites and correspond to the sites described in Table 1
Fig. 3
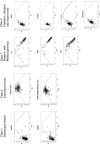
Graphic presentation of the effective codon number (Nc) and proportion GC in the third codon position (GC3) for each poxviral species. The 21 members have been clustered into groups based on their effective codon numbers. Each open reading frame is represented by a dot and the theoretical Nc at any given proportion of GC3 is drawn as a line
Fig. 4
There is a strong correlation between the GC content of the third synonymous codon position (GC3) and the GC content of the first and second codon positions (GC1+2). Each data point represents the average values calculated for each poxvirus species. The groupings described for Fig. 2 are circled and each species is identified by an abbreviated name. The abbreviations are taken from Table 1
Fig. 5
Codon bias of conserved genes is not maintained amongst the poxvirus species. The effective codon number as an estimate of codon usage for DNA polymerase, P4a and uracil DNA glycosidase was calculated for each species and compared within and between species
Fig. 6
Codon optimization of several tanapox virus genes improves the transient expression. The left panel illustrates the expression results following transfection of HEK293 cells with various plasmids encoding the native or optimized genes from tanapoxvirus. The right panel shows the same samples transfected into Cos7 cells
Fig. 7
Comparison of natural gene codon usage versus optimized codon usage. The effective codon numbers for three native TPV genes are compared against the effective codon numbers of the same genes following codon optimization
Fig. 8
G + C content at the three colon positions against the total GC content within each poxvirus member. The open circles represent GC1 versus GCtotal, the open squares indicate GC2 versus GCtotal and the open triangles are GC3 versus GCtotal. The lines represent best fit
Similar articles
- Genus specific evolution of codon usage and nucleotide compositional traits of poxviruses.
Roychoudhury S, Pan A, Mukherjee D. Roychoudhury S, et al. Virus Genes. 2011 Apr;42(2):189-99. doi: 10.1007/s11262-010-0568-2. Epub 2011 Jan 11. Virus Genes. 2011. PMID: 21369827 - Identification of Novel Cetacean Poxviruses in Cetaceans Stranded in South West England.
Barnett J, Dastjerdi A, Davison N, Deaville R, Everest D, Peake J, Finnegan C, Jepson P, Steinbach F. Barnett J, et al. PLoS One. 2015 Jun 5;10(6):e0124315. doi: 10.1371/journal.pone.0124315. eCollection 2015. PLoS One. 2015. PMID: 26046847 Free PMC article. - Characterization of the promoter activity of a poxvirus conserved element.
Eaton HE, Metcalf J, Brunetti CR. Eaton HE, et al. Can J Microbiol. 2008 Jun;54(6):483-8. doi: 10.1139/w08-033. Can J Microbiol. 2008. PMID: 18535635 - Gene therapy with poxvirus vectors.
Moroziewicz D, Kaufman HL. Moroziewicz D, et al. Curr Opin Mol Ther. 2005 Aug;7(4):317-25. Curr Opin Mol Ther. 2005. PMID: 16121697 Review. - Translational control during poxvirus infection.
Meade N, DiGiuseppe S, Walsh D. Meade N, et al. Wiley Interdiscip Rev RNA. 2019 Mar;10(2):e1515. doi: 10.1002/wrna.1515. Epub 2018 Oct 31. Wiley Interdiscip Rev RNA. 2019. PMID: 30381906 Free PMC article. Review.
Cited by
- Codon-optimized fluorescent proteins designed for expression in low-GC gram-positive bacteria.
Sastalla I, Chim K, Cheung GY, Pomerantsev AP, Leppla SH. Sastalla I, et al. Appl Environ Microbiol. 2009 Apr;75(7):2099-110. doi: 10.1128/AEM.02066-08. Epub 2009 Jan 30. Appl Environ Microbiol. 2009. PMID: 19181829 Free PMC article. - Ectromelia virus encodes a novel family of F-box proteins that interact with the SCF complex.
van Buuren N, Couturier B, Xiong Y, Barry M. van Buuren N, et al. J Virol. 2008 Oct;82(20):9917-27. doi: 10.1128/JVI.00953-08. Epub 2008 Aug 6. J Virol. 2008. PMID: 18684824 Free PMC article. - Novel strategies for development of hemorrhagic fever arenavirus live-attenuated vaccines.
Martinez-Sobrido L, de la Torre JC. Martinez-Sobrido L, et al. Expert Rev Vaccines. 2016 Sep;15(9):1113-21. doi: 10.1080/14760584.2016.1182024. Epub 2016 May 13. Expert Rev Vaccines. 2016. PMID: 27118328 Free PMC article. Review. - Expression of frog virus 3 genes is impaired in mammalian cell lines.
Eaton HE, Metcalf J, Brunetti CR. Eaton HE, et al. Virol J. 2008 Jul 21;5:83. doi: 10.1186/1743-422X-5-83. Virol J. 2008. PMID: 18644137 Free PMC article. - Genus specific evolution of codon usage and nucleotide compositional traits of poxviruses.
Roychoudhury S, Pan A, Mukherjee D. Roychoudhury S, et al. Virus Genes. 2011 Apr;42(2):189-99. doi: 10.1007/s11262-010-0568-2. Epub 2011 Jan 11. Virus Genes. 2011. PMID: 21369827
References
Publication types
MeSH terms
Substances
LinkOut - more resources
Full Text Sources
Other Literature Sources
Research Materials


