CAVER: a new tool to explore routes from protein clefts, pockets and cavities - PubMed (original) (raw)
CAVER: a new tool to explore routes from protein clefts, pockets and cavities
Martin Petrek et al. BMC Bioinformatics. 2006.
Abstract
Background: The main aim of this study was to develop and implement an algorithm for the rapid, accurate and automated identification of paths leading from buried protein clefts, pockets and cavities in dynamic and static protein structures to the outside solvent.
Results: The algorithm to perform a skeleton search was based on a reciprocal distance function grid that was developed and implemented for the CAVER program. The program identifies and visualizes routes from the interior of the protein to the bulk solvent. CAVER was primarily developed for proteins, but the algorithm is sufficiently robust to allow the analysis of any molecular system, including nucleic acids or inorganic material. Calculations can be performed using discrete structures from crystallographic analysis and NMR experiments as well as with trajectories from molecular dynamics simulations. The fully functional program is available as a stand-alone version and as plug-in for the molecular modeling program PyMol. Additionally, selected functions are accessible in an online version.
Conclusion: The algorithm developed automatically finds the path from a starting point located within the interior of a protein. The algorithm is sufficiently rapid and robust to enable routine analysis of molecular dynamics trajectories containing thousands of snapshots. The algorithm is based on reciprocal metrics and provides an easy method to find a centerline, i.e. the spine, of complicated objects such as a protein tunnel. It can also be applied to many other molecules. CAVER is freely available from the web site http://loschmidt.chemi.muni.cz/caver/.
Figures
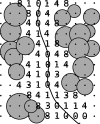
Figure 1
Sketch of the method implemented in CAVER. The black bold circle represents the starting point. The protein is visualized by gray circles with van der Walls atom radii mapped on a discrete grid (black dots). The solid line represents the boundary between the protein (convex hull) interior and its surroundings. Empty circles represent the maximally inscribed balls on the probable route (dashed line).
Figure 2
Evaluation of grid nodes by cost function. A grid point evaluation using the cost function (Eq. 3). The line represents the optimal centerline.
Figure 3
Access path visualized by pyMol. Visualization of the access route using the PyMol plug-in. Wires represent the protein surface, balls are nodes and the surface represents the export route.
Figure 4
Path profile convergence. Convergence of the path profile found on the grid with increasing precision, i.e. decreasing node distance d. Calculation of one path takes approximately 11 sec in case of d = 0.7°A (Athlon 2600+, 2GB RAM, NetBSD 1.6.1) but increases ten-fold in a substrate where d = 0.3°A.
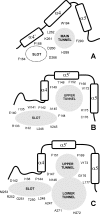
Figure 5
Scheme of haloalkane dehalogenases' tunnels. Schematic representation of access paths for DhlA (A), DhaA (B) and LinB (C) identified by protein crystallography [19–31] and molecular dynamic simulations [32]. The slot in DhlA was described in this study.
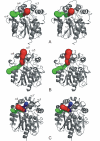
Figure 6
Tunnels found by CAVER. Accessible paths identified by CAVER in DhlA (A), DhaA (B) and LinB (C). The most accessible tunnel in every structure (main in DhlA, upper in DhaA and lower in LinB) is colored in red. The upper tunnel of LinB is in blue. Slots are highlighted in green for each structure.
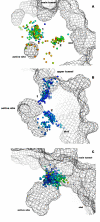
Figure 7
Tunnels' gorges as found by CAVER in MD trajectories. Analysis of snapshots taken from a molecular dynamics simulation of DhlA (A), DhaA (B) and LinB (C). Two clusters of tunnel gorges were identified in DhlA simulation (denoted by the numbers 1 and 2). Three clusters were identified in the DhaA simulation (denoted by the numbers 1–3) and one cluster was identified in the LinB simulation. Tunnel gorges are represented by small balls. Ball color correlates with gorge radius, balls representing narrow gorges are red and wide gorges are blue. The mesh represents the protein surface.
Similar articles
- Identification of tunnels in proteins, nucleic acids, inorganic materials and molecular ensembles.
Damborský J, Petrek M, Banás P, Otyepka M. Damborský J, et al. Biotechnol J. 2007 Jan;2(1):62-7. doi: 10.1002/biot.200600208. Biotechnol J. 2007. PMID: 17183511 - MOLE: a Voronoi diagram-based explorer of molecular channels, pores, and tunnels.
Petrek M, Kosinová P, Koca J, Otyepka M. Petrek M, et al. Structure. 2007 Nov;15(11):1357-63. doi: 10.1016/j.str.2007.10.007. Structure. 2007. PMID: 17997961 - CAVER Analyst 2.0: analysis and visualization of channels and tunnels in protein structures and molecular dynamics trajectories.
Jurcik A, Bednar D, Byska J, Marques SM, Furmanova K, Daniel L, Kokkonen P, Brezovsky J, Strnad O, Stourac J, Pavelka A, Manak M, Damborsky J, Kozlikova B. Jurcik A, et al. Bioinformatics. 2018 Oct 15;34(20):3586-3588. doi: 10.1093/bioinformatics/bty386. Bioinformatics. 2018. PMID: 29741570 Free PMC article. - CAVER 3.0: a tool for the analysis of transport pathways in dynamic protein structures.
Chovancova E, Pavelka A, Benes P, Strnad O, Brezovsky J, Kozlikova B, Gora A, Sustr V, Klvana M, Medek P, Biedermannova L, Sochor J, Damborsky J. Chovancova E, et al. PLoS Comput Biol. 2012;8(10):e1002708. doi: 10.1371/journal.pcbi.1002708. Epub 2012 Oct 18. PLoS Comput Biol. 2012. PMID: 23093919 Free PMC article. - Recent developments in structural proteomics for protein structure determination.
Liu HL, Hsu JP. Liu HL, et al. Proteomics. 2005 May;5(8):2056-68. doi: 10.1002/pmic.200401104. Proteomics. 2005. PMID: 15846841 Review.
Cited by
- Substrate tunnels in enzymes: structure-function relationships and computational methodology.
Kingsley LJ, Lill MA. Kingsley LJ, et al. Proteins. 2015 Apr;83(4):599-611. doi: 10.1002/prot.24772. Epub 2015 Feb 28. Proteins. 2015. PMID: 25663659 Free PMC article. Review. - Structural, bioinformatic, and in vivo analyses of two Treponema pallidum lipoproteins reveal a unique TRAP transporter.
Deka RK, Brautigam CA, Goldberg M, Schuck P, Tomchick DR, Norgard MV. Deka RK, et al. J Mol Biol. 2012 Mar 9;416(5):678-96. doi: 10.1016/j.jmb.2012.01.015. Epub 2012 Jan 27. J Mol Biol. 2012. PMID: 22306465 Free PMC article. - Investigation of indazole unbinding pathways in CYP2E1 by molecular dynamics simulations.
Shen Z, Cheng F, Xu Y, Fu J, Xiao W, Shen J, Liu G, Li W, Tang Y. Shen Z, et al. PLoS One. 2012;7(3):e33500. doi: 10.1371/journal.pone.0033500. Epub 2012 Mar 19. PLoS One. 2012. PMID: 22442693 Free PMC article. - Substrate path in the AcrB multidrug efflux pump of Escherichia coli.
Husain F, Nikaido H. Husain F, et al. Mol Microbiol. 2010 Oct;78(2):320-30. doi: 10.1111/j.1365-2958.2010.07330.x. Epub 2010 Aug 20. Mol Microbiol. 2010. PMID: 20804453 Free PMC article.
References
- Kleywegt GJ, Jones TA. Detection, delineation, measurement and display of cavities in macromolecular structures. Acta Crystallographica Section D. 1994;50:178–185. - PubMed
- Lesk AM. Molecular speleology – the exploration of crevices in proteins for prediction of binding-sites, design of drugs and analysis of surface recognition. Acta Crystallographica Section A. 1986;42:83–85.
- Chaloupkova R, Sykorova J, Prokop Z, Jesenska A, Monincovaa M, Pavlova M, Tsuda M, Nagata Y, Damborsky J. Modification of activity and specificity of haloalkane dehalogenase from Sphingomonas paucimobilis UT26 by engineering of its entrance tunnel. Journal of Biological Chemistry. 2003;278:52622–52628. doi: 10.1074/jbc.M306762200. - DOI - PubMed
Publication types
MeSH terms
Substances
LinkOut - more resources
Full Text Sources
Other Literature Sources


