Alpha-synuclein blocks ER-Golgi traffic and Rab1 rescues neuron loss in Parkinson's models - PubMed (original) (raw)
. 2006 Jul 21;313(5785):324-8.
doi: 10.1126/science.1129462. Epub 2006 Jun 22.
Aaron D Gitler, Anil Cashikar, Cole M Haynes, Kathryn J Hill, Bhupinder Bhullar, Kangning Liu, Kexiang Xu, Katherine E Strathearn, Fang Liu, Songsong Cao, Kim A Caldwell, Guy A Caldwell, Gerald Marsischky, Richard D Kolodner, Joshua Labaer, Jean-Christophe Rochet, Nancy M Bonini, Susan Lindquist
Affiliations
- PMID: 16794039
- PMCID: PMC1983366
- DOI: 10.1126/science.1129462
Alpha-synuclein blocks ER-Golgi traffic and Rab1 rescues neuron loss in Parkinson's models
Antony A Cooper et al. Science. 2006.
Abstract
Alpha-synuclein (alphaSyn) misfolding is associated with several devastating neurodegenerative disorders, including Parkinson's disease (PD). In yeast cells and in neurons alphaSyn accumulation is cytotoxic, but little is known about its normal function or pathobiology. The earliest defect following alphaSyn expression in yeast was a block in endoplasmic reticulum (ER)-to-Golgi vesicular trafficking. In a genomewide screen, the largest class of toxicity modifiers were proteins functioning at this same step, including the Rab guanosine triphosphatase Ypt1p, which associated with cytoplasmic alphaSyn inclusions. Elevated expression of Rab1, the mammalian YPT1 homolog, protected against alphaSyn-induced dopaminergic neuron loss in animal models of PD. Thus, synucleinopathies may result from disruptions in basic cellular functions that interface with the unique biology of particular neurons to make them especially vulnerable.
Figures
Fig. 1
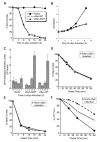
Expression of αSyn causes cell death and ER stress and impairs ERAD. (A) Survivorship curve during αSyn induction. After induction of αSyn-WT, αSyn-A53T expression, or control cells (Vector), cells with an optical density at 600 nm (OD600nm) of 1 were harvested and treated as described (24). Colony-forming units were determined and converted to relative percentages. (B) Growth curve during αSyn induction. After induction, the OD600nm for each sample was measured at the indicated times. (C) Cells induced for expression of αSyn-WT, αSyn-A53T, or control cells (Vector) were harvested at the times indicated; the level of UPR activation was then determined and plotted as relative units of ER stress. The degradation rate of Deg1-βGal (D), Sec61-2p (E), and CPY* (F), after 6 hours of either αSyn-WT or αSyn-A53T expression, was determined by pulse-chase immunoprecipitation as described (24) and compared to that of control cells (Vector).
Fig. 2
αSyn accumulation causes a severe block in vesicular trafficking in the early secretory pathway. The trafficking of CPY (A and B) and ALP (C and D) was monitored in cells expressing αSyn-WT or αSyn-A53T at the times indicated by pulse-chase immunoprecipitation and compared to that of control cells (Vector). (B) Graphic representation of the amount of CPY remaining in the ER [p1/(p1 + p2 + mCPY)]. (D) Graphic representation of the amount of ALP remaining in the ER [p1/(p1 + p2 + mALP)]. For CPY, p1 is the ER form, p2 is the Golgi form, and m is the mature vacuolar form. For ALP, p is the ER form and m is the mature vacuolar form.
Fig. 3
Plasmid overexpression screen identifies ER-Golgi trafficking genes as modifiers of αSyn toxicity. (A) Representative plates from αSyn modifier screen (24). αSyn-expressing cells were transformed individually with each of 3000 random ORFs under the control of a galactose-inducible promoter. Transformants were grown on synthetic media containing either glucose (control, αSyn ‘‘off’’) or galactose (to induce expression of αSyn and candidate ORFs, αSyn ‘‘on’’). Examples of strong- and moderate-toxicity suppressors are shown as black and blue circles, respectively. Examples of enhancers of αSyn-induced toxicity are shown as red circles, and a false-positive that did not reproduce upon further analysis is shown as a yellow circle. (B) Spotting assay shows that overexpression of ER-Golgi trafficking genes YPT1, YKT6, BRE5, UBP3, and ERV29 suppress αSyn-induced toxicity, whereas GYP8 and PMR1 overexpression enhances toxicity. (C) Suppression of toxicity is specific to the transport step facilitated by YPT1, because overexpression of other Rab GTPases has no effect on growth.
Fig. 4
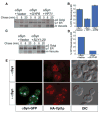
αSyn-induced cyto-toxicity and vesicular trafficking defects are modified by ER-Golgi trafficking components. The trafficking of CPY in cells expressing αSyn-WTand harboring either galactose-inducible GYP8 (A and B), galactose-inducible YPT1 (A and B), or SLY1-20 (C and D) was monitored by radio-labeling after 7 hours (C and D) or 8 hours (A and B) of induction and compared to trafficking in control cells (Vector). (B and D) Graphic representation of the amount of CPY remaining in the ER [p1/(p1 + p2 + mCPY)]. (E) Cells expressing αSyn-WT–GFP (green fluorescence protein) and HA (hemagglutin)–Ypt1p were examined by fluorescence and indirect immunofluorescence microscopy after 6 hours of αSyn induction.
Fig. 5
Expression of Rab1 rescues DA neuron loss in animal models of PD. (A to C) Studies in Drosophila. (A and B) Aged fly brains immuno-stained for TH to highlight DA neurons; selective loss of TH immunostaining in the DM1 cluster is fully prevented by Rab1. Genotypes TH-GAL4 UAS-αSyn in trans to + or UAS-Rab1. (C) Quantitation of TH-positive neurons in DM1 cluster. Wild-type (αSyn) or mutant (A53T) αSyn causes loss of TH that is prevented by Rab1. Genotypes: TH-GAL4/+ (wildtype), TH-GAL4 UAS-αSyn or TH-GAL4 UAS-A53T in trans to + or UAS-Rab1 (two independent lines). (*) Values significantly different from αSyn or A53T, P < 0.00001, Student’s t test. (D) DA toxicity in C. elegans, reflected by degeneration of cephalic sensilla (CEP) neuronal processes in P_dat-1_::GFP + P_dat-1_::αSyn at the 7-day stage. The arrow highlights the single CEP process remaining. (E) Intact DA neurons in P_dat-1_::GFP + P_dat-1_::α Syn + P_dat-1_::Rab1 at the 7-day stage. (F) Quantitation of Rab1 rescue of αSyn-induced neuron loss in three independent transgenic lines. (**) Values significantly different from αSyn, P < 0.05, Student’s t test. Scale bars: 20 μm. (G) Studies in rat midbrain primary neurons. Rab1 protects primary DA neurons from toxicity induced by αSyn-A53T. Primary midbrain cultures were transduced with lentivirus encoding αSyn-A53T alone, or αSyn-A53T plus β-Gal (LacZ), or αSyn-A53T plus Rab1. Control cells were cultured in the absence of lentivirus. Selective DA cell death was evaluated immunocytochemically. Viability is expressed as the percentage of MAP2-positive neurons that were also TH-positive (three independent experiments, at least 100 cells counted per experiment for each condition). The data are presented as the mean ± SD, n = 3 experiments; ***P < 0.01, analysis of variance with Newman-Keuls post-test.
Similar articles
- alpha-synuclein and Parkinson's disease: the first roadblock.
Chua CE, Tang BL. Chua CE, et al. J Cell Mol Med. 2006 Oct-Dec;10(4):837-46. doi: 10.1111/j.1582-4934.2006.tb00528.x. J Cell Mol Med. 2006. PMID: 17125588 Review. - The Parkinson's disease protein alpha-synuclein disrupts cellular Rab homeostasis.
Gitler AD, Bevis BJ, Shorter J, Strathearn KE, Hamamichi S, Su LJ, Caldwell KA, Caldwell GA, Rochet JC, McCaffery JM, Barlowe C, Lindquist S. Gitler AD, et al. Proc Natl Acad Sci U S A. 2008 Jan 8;105(1):145-50. doi: 10.1073/pnas.0710685105. Epub 2007 Dec 27. Proc Natl Acad Sci U S A. 2008. PMID: 18162536 Free PMC article. - Rab1A over-expression prevents Golgi apparatus fragmentation and partially corrects motor deficits in an alpha-synuclein based rat model of Parkinson's disease.
Coune PG, Bensadoun JC, Aebischer P, Schneider BL. Coune PG, et al. J Parkinsons Dis. 2011;1(4):373-87. doi: 10.3233/JPD-2011-11058. J Parkinsons Dis. 2011. PMID: 23939344 - Alpha-synuclein-induced aggregation of cytoplasmic vesicles in Saccharomyces cerevisiae.
Soper JH, Roy S, Stieber A, Lee E, Wilson RB, Trojanowski JQ, Burd CG, Lee VM. Soper JH, et al. Mol Biol Cell. 2008 Mar;19(3):1093-103. doi: 10.1091/mbc.e07-08-0827. Epub 2008 Jan 2. Mol Biol Cell. 2008. PMID: 18172022 Free PMC article. - Rescuing defective vesicular trafficking protects against alpha-synuclein toxicity in cellular and animal models of Parkinson's disease.
Lashuel HA, Hirling H. Lashuel HA, et al. ACS Chem Biol. 2006 Aug 22;1(7):420-4. doi: 10.1021/cb600331e. ACS Chem Biol. 2006. PMID: 17168518 Review.
Cited by
- A conformational switch driven by phosphorylation regulates the activity of the evolutionarily conserved SNARE Ykt6.
McGrath K, Agarwal S, Tonelli M, Dergai M, Gaeta AL, Shum AK, Lacoste J, Zhang Y, Wen W, Chung D, Wiersum G, Shevade A, Zaichick S, van Rossum DB, Shuvalova L, Savas JN, Kuchin S, Taipale M, Caldwell KA, Caldwell GA, Fasshauer D, Caraveo G. McGrath K, et al. Proc Natl Acad Sci U S A. 2021 Mar 23;118(12):e2016730118. doi: 10.1073/pnas.2016730118. Proc Natl Acad Sci U S A. 2021. PMID: 33723042 Free PMC article. - Engineering enhanced protein disaggregases for neurodegenerative disease.
Jackrel ME, Shorter J. Jackrel ME, et al. Prion. 2015;9(2):90-109. doi: 10.1080/19336896.2015.1020277. Prion. 2015. PMID: 25738979 Free PMC article. Review. - PGC-1α activity in nigral dopamine neurons determines vulnerability to α-synuclein.
Ciron C, Zheng L, Bobela W, Knott GW, Leone TC, Kelly DP, Schneider BL. Ciron C, et al. Acta Neuropathol Commun. 2015 Apr 1;3:16. doi: 10.1186/s40478-015-0200-8. Acta Neuropathol Commun. 2015. PMID: 25853296 Free PMC article. - Reducing Endogenous α-Synuclein Mitigates the Degeneration of Selective Neuronal Populations in an Alzheimer's Disease Transgenic Mouse Model.
Spencer B, Desplats PA, Overk CR, Valera-Martin E, Rissman RA, Wu C, Mante M, Adame A, Florio J, Rockenstein E, Masliah E. Spencer B, et al. J Neurosci. 2016 Jul 27;36(30):7971-84. doi: 10.1523/JNEUROSCI.0775-16.2016. J Neurosci. 2016. PMID: 27466341 Free PMC article. - Using iPS Cells toward the Understanding of Parkinson's Disease.
Torrent R, De Angelis Rigotti F, Dell'Era P, Memo M, Raya A, Consiglio A. Torrent R, et al. J Clin Med. 2015 Mar 30;4(4):548-66. doi: 10.3390/jcm4040548. J Clin Med. 2015. PMID: 26239346 Free PMC article. Review.
References
- Vila M, Przedborski S. Nat Med. 2004;10(Suppl):S58. - PubMed
- Forman MS, Trojanowski JQ, Lee VM. Nat Med. 2004;10:1055. - PubMed
- Polymeropoulos MH, et al. Science. 1997;276:2045. - PubMed
- Kruger R, et al. Nat Genet. 1998;18:106. - PubMed
Publication types
MeSH terms
Substances
LinkOut - more resources
Full Text Sources
Other Literature Sources
Molecular Biology Databases


