Conformational states of the severe acute respiratory syndrome coronavirus spike protein ectodomain - PubMed (original) (raw)
Conformational states of the severe acute respiratory syndrome coronavirus spike protein ectodomain
Fang Li et al. J Virol. 2006 Jul.
Abstract
The severe acute respiratory syndrome coronavirus enters cells through the activities of a spike protein (S) which has receptor-binding (S1) and membrane fusion (S2) regions. We have characterized four sequential states of a purified recombinant S ectodomain (S-e) comprising S1 and the ectodomain of S2. They are S-e monomers, uncleaved S-e trimers, cleaved S-e trimers, and dissociated S1 monomers and S2 trimer rosettes. Lowered pH induces an irreversible transition from flexible, L-shaped S-e monomers to clove-shaped trimers. Protease cleavage of the trimer occurs at the S1-S2 boundary; an ensuing S1 dissociation leads to a major rearrangement of the trimeric S2 and to formation of rosettes likely to represent clusters of elongated, postfusion trimers of S2 associated through their fusion peptides. The states and transitions of S suggest conformational changes that mediate viral entry into cells.
Figures
FIG. 1.
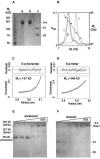
Oligomeric states of the purified recombinant SARS coronavirus S-e. (A) Coomassie blue-stained reducing SDS-PAGE. Lane a, as purified from insect cell medium; lane b, exposed to pH 5.6; lane c, exposed to pH 5.6 and then digested (at neutral pH) with 200 ng/ml trypsin. (B) Gel filtration chromatography on Superdex 200. Samples correspond to those in panel A, as indicated by the lettering of the chromatograms. Black circles indicate migration of calibration standards (thyroglobulin, 669 kDa; ferritin, 440 kDa; catalase, 232 kDa; aldolase, 158 kDa). The fitted curve is a dotted line. The apparent molecular mass is 226 kDa for the monomer and 520 kDa for both intact and cleaved trimers. (C) Equilibrium analytical ultracentrifugation of purified S-e. Blue circles indicate the concentration distribution (_A_280) of a 0.25-mg/ml sample at 10,500 rpm. The curve indicates the theoretical distribution of a 157-kDa particle. (D) Analytical ultracentrifugation of S-e after exposure to pH 5.6. Circles show the equilibrium distribution (_A_280) of a 0.25-mg/ml sample at 5,500 rpm. The curve shows the theoretical distribution of a 446-kDa particle. (E) Chemical cross-linking of S-e after exposure to pH 5.6. Prior to separation by SDS-PAGE and staining with Coomassie blue, low-pH-treated S-e was incubated with (from left to right) 0, 0.01, 0.05, 0.2, 1, or 5 mM EGS. The indicated molecular masses were determined by mass spectrometry. (F) Chemical cross-linking of S-e after exposure to pH 5.6 and cleavage with 200 ng/ml trypsin. Samples were analyzed as in panel E.
FIG. 2.
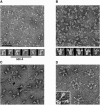
Electron micrographs of S-e preparations. (A) S-e monomers have an L shape with variable morphology. (B) After exposure to pH 5.6, S-e trimers have a homogeneous clove-like shape with three knobs at the broader end of a tapered shaft. (C) After trypsin cleavage, most S-e trimers retain the morphology seen in panel B. Several molecules show evidence of rearrangement at one end (arrows). (D) After cleaved trimers have been incubated in 1 M urea for 2 h at room temperature, a field of rosettes is obtained. The inset shows part of one rosette. The short and long scale bars in panel A apply to all of the electron microscopy fields and extracted individual images (including the inset in panel D), respectively. All samples were stained with 0.75% uranyl formate.
FIG. 3.
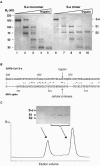
Trypsin cleavage of S-e. (A) S-e monomers (lanes 1 to 5) and trimers (lanes 6 to 10) were incubated at room temperature for 30 min with trypsin (0, 10−4, 10−3, 10−2, and 1 mg/ml for lanes 1 to 5 and 6 to 10). After quenching with PMSF, the samples were resolved by SDS-PAGE and stained with Coomassie blue. (B) Sequence alignment of the SARS CoV and MHV (strain 2, accession number AF201929) S proteins at the S1-S2 boundary region. The arrows indicate the trypsin cleavage site in the SARS CoV S protein and the site of cleavage by a cellular protease in the MHV S protein. (C) Gel filtration chromatography of the products of tryptic cleavage of S-e monomers. (Inset) SDS-PAGE analysis of the void volume and of the peak. The peak contains soluble, monomeric S-1; the void contains residual aggregated S-2 (some of which precipitates) and a trace of uncleaved S-e.
FIG. 4.
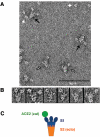
Binding of the soluble ACE2 catalytic domain to uncleaved trimeric S-e. (A) Field of complexes negatively stained with uranyl formate. The molar ratio of the ACE2 catalytic domain to the S-e trimer was 10:1. Black arrows, trimers with at least two bound ACE2 catalytic domains; hollow black arrows, trimers with a single bound ACE2; white arrows, free ACE2 catalytic domain. (B) Gallery of images from panel A and other, similar fields. (C) Interpretative diagram. The ACE2 catalytic domain [ACE2(cat)] associates with the bumps on the trimer, schematized here as ovals, which therefore contain the RBD and perhaps additional parts of the S polypeptide chain (14).
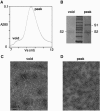
FIG. 5.
Spontaneous rosette formation. (A) Chromatogram (_A_280) of the S-e trimer digested with 200 ng/ml trypsin for 30 min at room temperature before quenching with PMSF and separation by gel filtration chromatography on Superdex 200. (B) Coomassie blue-stained reducing SDS-PAGE of protein from the void volume shows only S2, while the protein from the peak shows both S1 and S2. (C) Electron microscopy of a sample from the void volume of panel A, negatively stained with uranyl formate, showing rosettes. (D) Electron microscopy of a negatively stained sample from the peak of panel A, showing undissociated, clove-shaped trimers.
FIG. 6.
States and transitions of S-e. (A) S-e monomer. S1, blue oval; S2, yellow rectangle, drawn here with curved lines to indicate flexibility. (B) S-e trimer. A low pH triggers trimerization and rigidification. (C) Cleaved S-e trimer. The arrows indicate the trypsin cleavage site at the junction of S1 and S2. (D) Rearranged S2 trimer. Dissociation of S1 occurs spontaneously, and it can be accelerated by exposure to 1 M urea. In this diagram, we depict the clustered fusion peptides of the three subunits as an irregularly outlined region at one end of the rearranged S2 shaft and the regions between HR1 and HR2 of the subunits as three ovals at the other end.
Similar articles
- Cryo-EM structure of the SARS coronavirus spike glycoprotein in complex with its host cell receptor ACE2.
Song W, Gui M, Wang X, Xiang Y. Song W, et al. PLoS Pathog. 2018 Aug 13;14(8):e1007236. doi: 10.1371/journal.ppat.1007236. eCollection 2018 Aug. PLoS Pathog. 2018. PMID: 30102747 Free PMC article. - Insights from the association of SARS-CoV S-protein with its receptor, ACE2.
Li W, Choe H, Farzan M. Li W, et al. Adv Exp Med Biol. 2006;581:209-18. doi: 10.1007/978-0-387-33012-9_36. Adv Exp Med Biol. 2006. PMID: 17037532 Free PMC article. Review. No abstract available. - Structural analysis of major species barriers between humans and palm civets for severe acute respiratory syndrome coronavirus infections.
Li F. Li F. J Virol. 2008 Jul;82(14):6984-91. doi: 10.1128/JVI.00442-08. Epub 2008 Apr 30. J Virol. 2008. PMID: 18448527 Free PMC article. - Synthesis and characterization of a native, oligomeric form of recombinant severe acute respiratory syndrome coronavirus spike glycoprotein.
Song HC, Seo MY, Stadler K, Yoo BJ, Choo QL, Coates SR, Uematsu Y, Harada T, Greer CE, Polo JM, Pileri P, Eickmann M, Rappuoli R, Abrignani S, Houghton M, Han JH. Song HC, et al. J Virol. 2004 Oct;78(19):10328-35. doi: 10.1128/JVI.78.19.10328-10335.2004. J Virol. 2004. PMID: 15367599 Free PMC article. - Severe acute respiratory syndrome coronavirus entry into host cells: Opportunities for therapeutic intervention.
Yeung KS, Yamanaka GA, Meanwell NA. Yeung KS, et al. Med Res Rev. 2006 Jul;26(4):414-33. doi: 10.1002/med.20055. Med Res Rev. 2006. PMID: 16521129 Free PMC article. Review.
Cited by
- The identification of novel inhibitors of human angiotensin-converting enzyme 2 and main protease of Sars-Cov-2: A combination of in silico methods for treatment of COVID-19.
Zarezade V, Rezaei H, Shakerinezhad G, Safavi A, Nazeri Z, Veisi A, Azadbakht O, Hatami M, Sabaghan M, Shajirat Z. Zarezade V, et al. J Mol Struct. 2021 Aug 5;1237:130409. doi: 10.1016/j.molstruc.2021.130409. Epub 2021 Apr 6. J Mol Struct. 2021. PMID: 33840836 Free PMC article. - Cell Entry of Porcine Epidemic Diarrhea Coronavirus Is Activated by Lysosomal Proteases.
Liu C, Ma Y, Yang Y, Zheng Y, Shang J, Zhou Y, Jiang S, Du L, Li J, Li F. Liu C, et al. J Biol Chem. 2016 Nov 18;291(47):24779-24786. doi: 10.1074/jbc.M116.740746. Epub 2016 Oct 11. J Biol Chem. 2016. PMID: 27729455 Free PMC article. - Thermodynamic analysis of the interactions between human ACE2 and spike RBD of Betacoronaviruses (SARS-CoV-1 and SARS-CoV-2).
Rombel-Bryzek A, Miller A, Witkowska D. Rombel-Bryzek A, et al. FEBS Open Bio. 2023 Jan;13(1):174-184. doi: 10.1002/2211-5463.13525. Epub 2022 Dec 9. FEBS Open Bio. 2023. PMID: 36416453 Free PMC article. - Elastase-mediated activation of the severe acute respiratory syndrome coronavirus spike protein at discrete sites within the S2 domain.
Belouzard S, Madu I, Whittaker GR. Belouzard S, et al. J Biol Chem. 2010 Jul 23;285(30):22758-63. doi: 10.1074/jbc.M110.103275. Epub 2010 May 27. J Biol Chem. 2010. PMID: 20507992 Free PMC article. - Structure-Based Mutations in the Herpes Simplex Virus 1 Glycoprotein B Ectodomain Arm Impart a Slow-Entry Phenotype.
Fan Q, Kopp SJ, Connolly SA, Longnecker R. Fan Q, et al. mBio. 2017 May 16;8(3):e00614-17. doi: 10.1128/mBio.00614-17. mBio. 2017. PMID: 28512095 Free PMC article.
References
- Cavanagh, D. 1995. The coronavirus surface glycoprotein. Plenum Press, New York, N.Y.
Publication types
MeSH terms
Substances
Grants and funding
- P01 GM062580/GM/NIGMS NIH HHS/United States
- P01-GM62580/GM/NIGMS NIH HHS/United States
- R37 CA013202/CA/NCI NIH HHS/United States
- CA13202/CA/NCI NIH HHS/United States
- R01 CA013202/CA/NCI NIH HHS/United States
LinkOut - more resources
Full Text Sources
Other Literature Sources
