Comparative isoschizomer profiling of cytosine methylation: the HELP assay - PubMed (original) (raw)
. 2006 Aug;16(8):1046-55.
doi: 10.1101/gr.5273806. Epub 2006 Jun 29.
Reid F Thompson, Kenny Ye, Melissa J Fazzari, Masako Suzuki, Edyta Stasiek, Maria E Figueroa, Jacob L Glass, Quan Chen, Cristina Montagna, Eli Hatchwell, Rebecca R Selzer, Todd A Richmond, Roland D Green, Ari Melnick, John M Greally
Affiliations
- PMID: 16809668
- PMCID: PMC1524864
- DOI: 10.1101/gr.5273806
Comparative isoschizomer profiling of cytosine methylation: the HELP assay
Batbayar Khulan et al. Genome Res. 2006 Aug.
Abstract
The distribution of cytosine methylation in 6.2 Mb of the mouse genome was tested using cohybridization of genomic representations from a methylation-sensitive restriction enzyme and its methylation-insensitive isoschizomer. This assay, termed HELP (HpaII tiny fragment Enrichment by Ligation-mediated PCR), allows both intragenomic profiling and intergenomic comparisons of cytosine methylation. The intragenomic profile shows most of the genome to be contiguous methylated sequence with occasional clusters of hypomethylated loci, usually but not exclusively at promoters and CpG islands. Intergenomic comparison found marked differences in cytosine methylation between spermatogenic and brain cells, identifying 223 new candidate tissue-specific differentially methylated regions (T-DMRs). Bisulfite pyrosequencing confirmed the four candidates tested to be T-DMRs, while quantitative RT-PCR for two genes with T-DMRs located at their promoters showed the HELP data to be correlated with gene activity at these loci. The HELP assay is robust, quantitative, and accurate and is providing new insights into the distribution and dynamic nature of cytosine methylation in the genome.
Figures
Figure 1.
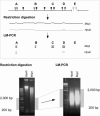
Principle of the HELP assay. The HELP assay is based on a comparison of representations from the genome following digestion by HpaII or its methylation-insensitive isoschizomer MspI. The representations are limited to a size range of 200–2000 bp by the use of ligation-mediated PCR. The MspI representation is the total potential population of sites that could be generated by the HpaII representation were none of these sites to be methylated. However, as 55%–70% of these sites are methylated in animal genomes (Bird 1980; Bestor et al. 1984), the HpaII representation will always represent a subset of the MspI representation. By comparing the relative representation at individual loci, assignment can be made of cytosine methylation status. While loci such as A should be amplified in both the HpaII and MspI representations, the failure of HpaII to digest both sites at loci B and C will yield a representation from MspI alone, while the partial methylation depicted at locus D should generate a lower HpaII/MspI ratio than at locus A. If a locus is deleted (or has a sequence change at the enzyme cleavage sites) as shown at E, neither representation will generate the locus.
Figure 2.
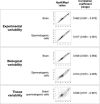
The variability due to tissue-specific differences in cytosine methylation greatly exceeds all other sources of variability. We show the mean and range of correlation coefficients for all of the experimental replicates (three independent HELP assays performed on DNA from a single mouse) and biological replicates (three different mice) for the HpaII/MspI ratios. An illustrative scattergram is shown for each situation. The variability involving HpaII/MspI representations across tissues greatly exceeds any of the other sources of variability in the experimental system.
Figure 3.
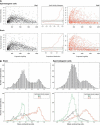
(A) Microarray signal characteristics for MspI (black) and HpaII (red). The signal intensities mirror the relative amount of product across the range of sizes in the PCR amplification. The HpaII representation shows the additional characteristic of a population of loci with low signal intensities, likely to represent the more methylated loci in the sample. A mixture model applied to the distribution allows loci to be categorized according to their relative signal intensities (center panel). (B) When the normalized mean HpaII/MspI log ratios are plotted as density histograms for each tissue, two populations of loci are apparent: the majority have low ratios, with a minority falling into a higher distribution. The breakdown of the log ratios by HpaII signal intensity category shows the low ratio peak to be mostly composed of those loci with lower HpaII signal intensities. In both tissues, a threshold of ∼0.15 serves to distinguish these two distributions.
Figure 4.
Intragenomic profiling and intergenomic comparisons for two chromosomal regions. The HpaII/MspI log ratios are depicted in terms of their deviation from the threshold value of 0.15. A downward deflection is indicative of a methylated locus, and an upward deflection is a relatively hypomethylated locus. (Red) Brain cells, (green) spermatogenic cells. Transcription start sites are shared, CpG islands are represented (green rectangles), and loci for which the fragment has one or both flanking HpaII sites located in a repetitive element are depicted (small triangle at the bottom of the graph). (Black triangles) Methylated, (blue) hypomethylated in at least one of the tissues tested. (Orange) Loci subsequently tested by bisulfite pyrosequencing. The red and green histograms are slightly shifted relative to each other for clarity. The intragenomic profile of cytosine methylation shows that methylation is the predominant pattern in these regions, with short blocks of hypomethylation located mostly at promoters and CpG islands, although some non-promoter, non-CpG island hypomethylation is also apparent. The intergenomic comparison between tissues shows overall concordance but some clear tissue-specific differences, such as those at the orange arrowheads.
Figure 5.
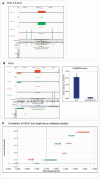
Validation studies using bisulfite pyrosequencing. The H19 locus indicated by the orange arrowhead in Fig. 4 was tested for cytosine methylation using bisulfite pyrosequencing of the original DNA samples used for the HELP assays. The samples from each of the three mice were tested individually. The primary data are provided in Supplemental Table 1, and are represented here as the median value of the three generated. The figures were generated by creating custom tracks for the UCSC Genome Browser and can be browsed in detail at
http://greallylab.aecom.yu.edu/\~greally/wiggle\_tracks/HELP\_data.htm
. The degree of cytosine methylation is plotted as a percentage for spermatogenic cells (green) and brain (red). The HELP data are shown for reference using the same color scheme. (A) The complete methylation of the HpaII sites at the H19 locus in spermatogenic cells is consistent with the methylated categorization in the HELP assay and with prior studies of this region in spermatogenic cells (Davis et al. 1999). The downstream HpaII site is more methylated in brain than the upstream site. As the proportion of molecules digested and available for amplification in the HELP assay is dependent on the digestion of both flanking sites, the site with the greater degree of methylation determines this proportion. We conclude that the 72.4% methylation of this site allowed the HELP representation categorized as hypomethylated. (B) The Hccs promoter shows clear differences in cytosine methylation between tissues at all HpaII sites tested, with a corresponding change in gene expression levels. (C) Correlation of all of the loci plotted by hypomethylation (bisulfite pyrosequencing data) against normalized HpaII/MspI ratios, with results from brain samples (red) and spermatogenic cell samples (green) shown.
Similar articles
- The HELP assay.
Oda M, Greally JM. Oda M, et al. Methods Mol Biol. 2009;507:77-87. doi: 10.1007/978-1-59745-522-0_7. Methods Mol Biol. 2009. PMID: 18987808 - A new class of tissue-specifically methylated regions involving entire CpG islands in the mouse.
Suzuki M, Sato S, Arai Y, Shinohara T, Tanaka S, Greally JM, Hattori N, Shiota K. Suzuki M, et al. Genes Cells. 2007 Dec;12(12):1305-14. doi: 10.1111/j.1365-2443.2007.01136.x. Genes Cells. 2007. PMID: 18076568 - HELP (HpaII tiny fragment enrichment by ligation-mediated PCR) assay for DNA methylation profiling of primary normal and malignant B lymphocytes.
Shaknovich R, Figueroa ME, Melnick A. Shaknovich R, et al. Methods Mol Biol. 2010;632:191-201. doi: 10.1007/978-1-60761-663-4_12. Methods Mol Biol. 2010. PMID: 20217579 - [Perspective of DNA methylation in forensic genetics and new progress of its detection methods].
Zhao SM, Li CT. Zhao SM, et al. Fa Yi Xue Za Zhi. 2009 Aug;25(4):290-5. Fa Yi Xue Za Zhi. 2009. PMID: 19788082 Review. Chinese. - Cytosine methylation and the ecology of intragenomic parasites.
Yoder JA, Walsh CP, Bestor TH. Yoder JA, et al. Trends Genet. 1997 Aug;13(8):335-40. doi: 10.1016/s0168-9525(97)01181-5. Trends Genet. 1997. PMID: 9260521 Review.
Cited by
- A critical appraisal of tools available for monitoring epigenetic changes in clinical samples from patients with myeloid malignancies.
Grønbæk K, Müller-Tidow C, Perini G, Lehmann S, Bach Treppendahl M, Mills K, Plass C, Schlegelberger B; European Genomics and Epigenomics Study on MDS and AML (EuGESMA), COST Action BM0801. Grønbæk K, et al. Haematologica. 2012 Sep;97(9):1380-8. doi: 10.3324/haematol.2011.058305. Epub 2012 Apr 4. Haematologica. 2012. PMID: 22491733 Free PMC article. - DNA methylation analysis in human cancer.
O'Sullivan E, Goggins M. O'Sullivan E, et al. Methods Mol Biol. 2013;980:131-56. doi: 10.1007/978-1-62703-287-2_7. Methods Mol Biol. 2013. PMID: 23359152 Free PMC article. - Tissue-restricted transcription from a conserved intragenic CpG island in the Klf1 gene in mice.
Southwood CM, Lipovich L, Gow A. Southwood CM, et al. Biol Reprod. 2012 Nov 1;87(5):108. doi: 10.1095/biolreprod.112.099879. Print 2012 Nov. Biol Reprod. 2012. PMID: 22933519 Free PMC article. - Differential binding of Escherichia coli McrA protein to DNA sequences that contain the dinucleotide m5CpG.
Mulligan EA, Hatchwell E, McCorkle SR, Dunn JJ. Mulligan EA, et al. Nucleic Acids Res. 2010 Apr;38(6):1997-2005. doi: 10.1093/nar/gkp1120. Epub 2009 Dec 16. Nucleic Acids Res. 2010. PMID: 20015968 Free PMC article. - Tagmentation-based whole-genome bisulfite sequencing.
Wang Q, Gu L, Adey A, Radlwimmer B, Wang W, Hovestadt V, Bähr M, Wolf S, Shendure J, Eils R, Plass C, Weichenhan D. Wang Q, et al. Nat Protoc. 2013 Oct;8(10):2022-32. doi: 10.1038/nprot.2013.118. Epub 2013 Sep 26. Nat Protoc. 2013. PMID: 24071908
References
- Bernardino J., Lombard M., Niveleau A., Dutrillaux B., Lombard M., Niveleau A., Dutrillaux B., Niveleau A., Dutrillaux B., Dutrillaux B. Common methylation characteristics of sex chromosomes in somatic and germ cells from mouse, lemur and human. Chromosome Res. 2000;8:513–525. - PubMed
- Bird A.P. CpG-rich islands and the function of DNA methylation. Nature. 1986;321:209–213. - PubMed
- Chen C.M., Chen H.L., Hsiau T.H., Hsiau A.H., Shi H., Brock G.J., Wei S.H., Caldwell C.W., Yan P.S., Huang T.H., Chen H.L., Hsiau T.H., Hsiau A.H., Shi H., Brock G.J., Wei S.H., Caldwell C.W., Yan P.S., Huang T.H., Hsiau T.H., Hsiau A.H., Shi H., Brock G.J., Wei S.H., Caldwell C.W., Yan P.S., Huang T.H., Hsiau A.H., Shi H., Brock G.J., Wei S.H., Caldwell C.W., Yan P.S., Huang T.H., Shi H., Brock G.J., Wei S.H., Caldwell C.W., Yan P.S., Huang T.H., Brock G.J., Wei S.H., Caldwell C.W., Yan P.S., Huang T.H., Wei S.H., Caldwell C.W., Yan P.S., Huang T.H., Caldwell C.W., Yan P.S., Huang T.H., Yan P.S., Huang T.H., Huang T.H. Methylation target array for rapid analysis of CpG island hypermethylation in multiple tissue genomes. Am. J. Pathol. 2003;163:37–45. - PMC - PubMed
Publication types
MeSH terms
Substances
LinkOut - more resources
Full Text Sources
Other Literature Sources
Miscellaneous


