Hippocampal synaptic plasticity and spatial learning are impaired in a rat model of sleep fragmentation - PubMed (original) (raw)
Hippocampal synaptic plasticity and spatial learning are impaired in a rat model of sleep fragmentation
Jaime L Tartar et al. Eur J Neurosci. 2006 May.
Abstract
Sleep fragmentation, a symptom in many clinical disorders, leads to cognitive impairments. To investigate the mechanisms by which sleep fragmentation results in memory impairments, rats were awakened once every 2 min via 30 s of slow movement on an automated treadmill. Within 1 h of this sleep interruption (SI) schedule, rats began to sleep in the 90-s periods without treadmill movement. Total non-rapid eye movement sleep (NREM) sleep time did not change over the 24 h of SI, although there was a significant decline in rapid eye movement sleep (REM) sleep and a corresponding increase in time spent awake. In the SI group, the mean duration of sleep episodes decreased and delta activity during periods of wake increased. Control rats either lived in the treadmill without movement (cage controls, CC), or had 10-min periods of movement followed by 30 min of non-movement allowing deep/continuous sleep (exercise controls, EC). EC did not differ from baseline in the total time spent in each vigilance state. Hippocampal long-term potentiation (LTP), a long-lasting change in synaptic efficacy thought to underlie declarative memory formation, was absent in rats exposed to 24 and 72 h SI. In contrast, LTP was normal in EC rats. However, long-term depression and paired-pulse facilitation were unaltered by 24 h SI. Twenty-four hour SI also impaired acquisition of spatial learning in the hippocampus-dependent water maze test. Twenty-four hour SI elevated plasma corticosterone (CORT) to levels previously shown to enhance LTP (125 ng/mL). The results suggest that sleep fragmentation negatively impacts spatial learning. Loss of N-methyl-D-aspartate (NMDA) receptor-dependent LTP in the hippocampal CA1 region may be one mechanism involved in this deficit.
Figures
Fig. 1
SI decreases sleep episode duration and increases the time spent awake, producing a sleep pattern resembling that of sleep fragmentation observed clinically. Sleep was interrupted (fragmented) for 24 h in the sleep interrupted (SI) group by automated treadmills (TM) operating on a continuous schedule of 30 s on and 90 s off (n = 5). Rats in the exercise control (EC) group were exposed to 10 min of TM on with 30 min of TM off (n = 3). (A) EEG and EMG activity from a rat on a SI schedule. When the TM is on (black horizontal bars), there is increased amplitude EMG activity and decreased amplitude, fast EEG activity. When the TM is off (grey horizontal bars) there is reduced EMG activity and high amplitude, slow EEG activity indicative of NREM sleep. Vertical and horizontal calibration bars indicate 100 μV and 15 s, respectively. (B) Compared to baseline (BL) recordings, SI decreases the average duration of individual sleep episodes, while the EC treatment increases the average duration of sleep episodes. In C and D, graphs show the percentage of time spent in wakefulness (W), non-rapid eye movement sleep (NREMS), and rapid eye movement sleep (REMS) in the SI, EC, and CC conditions. (C) During SI the percentage of time awake increases, the percentage of time in REMS decreases and NREMS time does not change. (D) EC does not affect the percentage of time spent in any vigilance state. In all graphs asterisks indicate P < 0.05 (_t_-test vs. BL).
Fig. 2
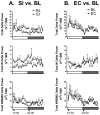
Delta power is increased during SI. (A) Sleep interruption (SI) (n = 5) results in an increase in total delta power (the amplitude of the electroencephalographic signal in the delta frequency range of 1–4 Hz). Graphs show average sum (± SEM) of delta power each hour during the lights on (clear horizontal bars) and lights off (dark horizontal bars) SI periods. There was a significant increase in total wakefulness (W) delta power (middle left), and a significant interaction of treatment × time for the NREM delta power (bottom left). (B) Exercise control (EC) (n = 3) did not produce any change in delta power during W (middle left) or NREMS (bottom right).
Fig. 3
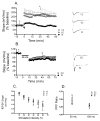
LTP is impaired after 24 h SI. Hippocampal synaptic plasticity in rats was examined after SI as compared to EC and cage CC conditions. In A and B data shown are in two 1 / 2 min bins. (A) 24 h SI blocks LTP (n = 6) compared to 24 h EC (n = 6) and CC (n = 8) groups (P < 0.05). Top left graph shows the average responses across time for all groups. Example fEPSP traces from individual rats at timepoints T1 (black) and T2 (grey) are shown on the right. The arrow represents the timepoint of tetanic stimulation. (B) LTD induced by paired-pulse low-frequency stimulation (PP–LFS) is not significantly different between the 24-h SI (n = 6) and the CC (n = 6) groups. Left graph shows the average responses across time for all groups. Horizontal bar represent timepoints of PP-LFS. Examples of fEPSP traces from individual rats at timepoints T1 (black) and T2 (grey) are shown on the right. (C) Plot of input–output (I–O) voltage curves for the SI and control (EC and CC) rats shows no differences between the groups in the amount of voltage necessary to evoke fEPSP responses at any point on the I–O curve. The plot shows fEPSP response up to lowest obtained saturation. (D) PPF is not significantly different between groups.
Fig. 4
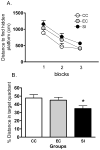
Spatial learning is impaired in the water maze after 24 h of SI. (A) Mean (± SEM) distance to reach the hidden platform for three blocks of four acquisition trials (SI, sleep interruption; n = 11; EC, n = 10; CC, n = 11). Overall, SI rats took a significantly longer path to reach the hidden platform than did CC (_P <_ 0.05), while EC rats were not significantly different from either group (_P_ > 0.05). A probe trial was given 30 min after the last acquisition trial (see text for details). (B) The mean percentage (+ SEM) of total distance travelled in the target quadrant that formerly contained the hidden platform in a single 30-s probe trial given 30 min after the last acquisition trial. SI rats swam significantly less distance in the target quadrant than did CC (_P <_ 0.05), but EC rats were not significantly different from either group (_P_ > 0.05). Asterisk indicates P < 0.05.
Similar articles
- Differential effects of duration of sleep fragmentation on spatial learning and synaptic plasticity in pubertal mice.
Wallace E, Kim DY, Kim KM, Chen S, Blair Braden B, Williams J, Jasso K, Garcia A, Rho JM, Bimonte-Nelson H, Maganti R. Wallace E, et al. Brain Res. 2015 Jul 30;1615:116-128. doi: 10.1016/j.brainres.2015.04.037. Epub 2015 May 7. Brain Res. 2015. PMID: 25957790 - Distinct modulatory effects of sleep on the maintenance of hippocampal and medial prefrontal cortex LTP.
Romcy-Pereira R, Pavlides C. Romcy-Pereira R, et al. Eur J Neurosci. 2004 Dec;20(12):3453-62. doi: 10.1111/j.1460-9568.2004.03808.x. Eur J Neurosci. 2004. PMID: 15610178 - REM sleep deprivation inhibits LTP in vivo in area CA1 of rat hippocampus.
Kim EY, Mahmoud GS, Grover LM. Kim EY, et al. Neurosci Lett. 2005 Nov 18;388(3):163-7. doi: 10.1016/j.neulet.2005.06.057. Neurosci Lett. 2005. PMID: 16039776 - Cognitive neuroscience of sleep.
Poe GR, Walsh CM, Bjorness TE. Poe GR, et al. Prog Brain Res. 2010;185:1-19. doi: 10.1016/B978-0-444-53702-7.00001-4. Prog Brain Res. 2010. PMID: 21075230 Free PMC article. Review. - Sleep, plasticity and memory from molecules to whole-brain networks.
Abel T, Havekes R, Saletin JM, Walker MP. Abel T, et al. Curr Biol. 2013 Sep 9;23(17):R774-88. doi: 10.1016/j.cub.2013.07.025. Curr Biol. 2013. PMID: 24028961 Free PMC article. Review.
Cited by
- A modified mouse model of perioperative neurocognitive disorders exacerbated by sleep fragmentation.
Wu T, Li M, Tian L, Cong P, Huang X, Wu H, Zhang Q, Zhang H, Xiong L. Wu T, et al. Exp Anim. 2023 Feb 21;72(1):55-67. doi: 10.1538/expanim.22-0053. Epub 2022 Sep 22. Exp Anim. 2023. PMID: 36130912 Free PMC article. - Sleep fragmentation impairs ventilatory long-term facilitation via adenosine A1 receptors.
McGuire M, Tartar JL, Cao Y, McCarley RW, White DP, Strecker RE, Ling L. McGuire M, et al. J Physiol. 2008 Nov 1;586(21):5215-29. doi: 10.1113/jphysiol.2008.158121. Epub 2008 Sep 11. J Physiol. 2008. PMID: 18787037 Free PMC article. - Sleep and synaptic plasticity in the developing and adult brain.
Frank MG. Frank MG. Curr Top Behav Neurosci. 2015;25:123-49. doi: 10.1007/7854_2014_305. Curr Top Behav Neurosci. 2015. PMID: 24671703 Free PMC article. Review. - Sleep and protein synthesis-dependent synaptic plasticity: impacts of sleep loss and stress.
Grønli J, Soulé J, Bramham CR. Grønli J, et al. Front Behav Neurosci. 2014 Jan 21;7:224. doi: 10.3389/fnbeh.2013.00224. eCollection 2013. Front Behav Neurosci. 2014. PMID: 24478645 Free PMC article. Review. - Sex-specific association of poor sleep quality with gray matter volume.
Neumann N, Lotze M, Domin M. Neumann N, et al. Sleep. 2020 Sep 14;43(9):zsaa035. doi: 10.1093/sleep/zsaa035. Sleep. 2020. PMID: 32140718 Free PMC article.
References
- Bastuji H, Garcia-Larrea L. Sleep / wake abnormalities in patients with periodic leg movements during sleep: factor analysis on data from 24-h ambulatory polygraphy. J Sleep Res. 1999;8:217–223. - PubMed
- Blissitt PA. Sleep, memory, and learning. J Neurosci Nurs. 2001;33:208– 215. - PubMed
- Bonnet MH. Performance and sleepiness as a function of frequency and placement of sleep disruption. Psychophysiology. 1986;23:263–271. - PubMed
- Bonnet MH. Sleep restoration as a function of periodic awakening, movement, or electroencephalographic change. Sleep. 1987;10:364–373. - PubMed
- Bonnet MH. Sleep Fragmentation. In: Lenfant C, editor. Sleep Deprivation. Marcel Dekker; New York: 2005. pp. 103–117.
Publication types
MeSH terms
Substances
Grants and funding
- K01 MH01798/MH/NIMH NIH HHS/United States
- R01 MH039683/MH/NIMH NIH HHS/United States
- F32 MH070156/MH/NIMH NIH HHS/United States
- R01 MH062522/MH/NIMH NIH HHS/United States
- P50 HL060292/HL/NHLBI NIH HHS/United States
- K01 MH001798/MH/NIMH NIH HHS/United States
- I01 BX001356/BX/BLRD VA/United States
- T32 HL007901/HL/NHLBI NIH HHS/United States
- R37 MH039683/MH/NIMH NIH HHS/United States
- T32 HL07901/HL/NHLBI NIH HHS/United States
LinkOut - more resources
Full Text Sources
Miscellaneous


