COPII-Golgi protein interactions regulate COPII coat assembly and Golgi size - PubMed (original) (raw)
COPII-Golgi protein interactions regulate COPII coat assembly and Golgi size
Yusong Guo et al. J Cell Biol. 2006.
Abstract
Under experimental conditions, the Golgi apparatus can undergo de novo biogenesis from the endoplasmic reticulum (ER), involving a rapid phase of growth followed by a return to steady state, but the mechanisms that control growth are unknown. Quantification of coat protein complex (COP) II assembly revealed a dramatic up-regulation at exit sites driven by increased levels of Golgi proteins in the ER. Analysis in a permeabilized cell assay indicated that up-regulation of COPII assembly occurred in the absence GTP hydrolysis and any cytosolic factors other than the COPII prebudding complex Sar1p-Sec23p-Sec24p. Remarkably, acting via a direct interaction with Sar1p, increased expression of the Golgi enzyme N-acetylgalactosaminyl transferase-2 induced increased COPII assembly on the ER and an overall increase in the size of the Golgi apparatus. These results suggest that direct interactions between Golgi proteins exiting the ER and COPII components regulate ER exit, providing a variable exit rate mechanism that ensures homeostasis of the Golgi apparatus.
Figures
Figure 1.
Golgi biogenesis coincides with increased COPII assembly. (A–H) NRK cells were untreated (A and E) or treated with BFA/H89 (30 min BFA and 10 min H89) followed by the indicated times of washout to allow Golgi assembly. The methanol-fixed cells were costained with anti-giantin (A–D) and anti-Sec13 antibodies (E–H). Single optical sections are shown. Bar, 10 μm. (I) To quantify COPII assembly and ER exit of giantin over time, total above-threshold fluorescence levels of Sec13 and giantin per NRK cell were determined (mean ± SEM; >15 cells each). Coincident with giantin exit, COPII assembly increased before returning to steady-state levels for untreated cells (dashed lines). (J) Quantified COPII assembly based on GFP-Sec13 expression in HeLa cells is compared for a representative cell after BFA/H89 washout and two untreated control cells. Imaging was at 2-min intervals, and values are corrected and normalized to adjust for slight photobleaching and to allow direct comparison. (K) Means per cell for the number, area, and intensity of above-threshold Sec13 objects are compared over time during BFA + H89 washout in NRK cells. Note that increases in exit sites, i.e., object number, and mean size account for the total COPII assembly increase shown in I.
Figure 2.
ER-localized Golgi proteins up-regulate COPII assembly. (A and B) At various times of BFA treatment (A) and washout (B), methanol-fixed NRK cells were analyzed for COPII assembly and post-ER mannosidase II (manII; mean ± SEM; >15 cells each). COPII assembly increased upon BFA-induced ER localization of Golgi enzymes and returned to the steady-state level of untreated cells (dashed lines) upon Golgi enzyme exit. (C) COPII assembly was quantified in paraformaldehyde-fixed and Sec13-stained HeLa cells stably expressing T2-GFP. Control cells were those that expressed little or no detectable T2-GFP, whereas overexpressing cells yielded strong Golgi staining and detectable ER staining. Values are normalized means ± SEM (n = 4; >25 cells each).
Figure 3.
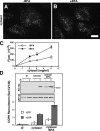
Increased COPII assembly occurs in the absence of GTP hydrolysis. (A and B) A permeabilized cell COPII assembly assay was performed on untreated (A) and BFA-treated (B) NRK cells. Reactions contained ATP, GTPγS, and 2 mg/ml cytosol. Images are single optical sections of paraformaldehyde-fixed cells showing Sec13 localization. Bar, 10 μm. (C) Quantification of Sec13 at exit sites indicated that, despite the presence of GTPγS, BFA-treated cells exhibited increased COPII assembly at the indicated cytosol concentrations (mean ± SEM; >15 cells each). (D) The permeabilized assay was also quantified by immunoblotting. Recovery of Sec13 and a loading control, the Golgi membrane protein GPP130, are shown for untreated or BFA-treated cells after incubation in buffer (Ø) or 4 mg/ml cytosol. Absence or presence of GTPγS is also indicated. Quantification of the Sec13/GPP130 ratio confirmed that COPII assembly was similarly increased by BFA despite the presence of GTPγS (mean ± SEM; n = 3).
Figure 4.
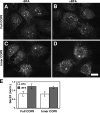
Purified COPII is sufficient for increased assembly. (A–D) A permeabilized cell COPII assembly assay was performed on untreated (A and C) and BFA-treated (B and D) NRK cells. Reactions contained ATP and GTPγS and either the full COPII components Sar1p, Sec24p–Sec23p, and Sec13p–Sec31p (A and B) or just the inner COPII components Sar1p and Sec24p–Sec23p (C and D). Images are single optical sections of paraformaldehyde-fixed cells showing Sec24p localization. Bar, 10 μm. (E) Quantified results based on Sec24p staining of untreated and BFA-treated permeabilized NRK cells are compared for COPII assembly using the full COPII components Sar1p, Sec24p–Sec23p, and Sec13p–Sec31p or the inner COPII components Sar1p and Sec24p–Sec23p (normalized mean ± SEM; >15 cells each).
Figure 5.
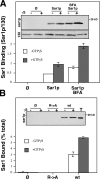
Purified Sar1p shows enhanced recruitment and binds GalNAcT2. (A) Untreated or BFA-treated permeabilized NRK cells were incubated without or with Sar1p in absence or presence of GTPγS. Recovery of membrane bound Sar1p and the loading control GPP130 was determined by immunoblotting. The quantified result, showing enhanced Sar1p binding to cells with ER-localized Golgi enzymes, is the ratio of Sar1p/GPP130 at each condition (mean ± SD; n = 2). (B) Purified Sar1p was tested for binding to the cytoplasmic domain peptide of GalNAcT2 (wild type [wt] = MRRRSRC) or a version with alanine substituted for arginine (R→A = MAAASAC). After incubation in the presence or absence of GTPγS, recovery of Sar1p bound to unconjugated (Ø) or peptide-conjugated thiopropyl Sepharose 6B beads was determined by immunoblotting. Each reaction contained 0.5 μg Sar1p, and 10% of this was also analyzed (T). The quantified results showing the percentage bound indicate a specific interaction (mean ± SD; n = 2).
Figure 6.
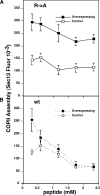
Binding of Sar1p to GalNAcT2 underlies assembly increase. (A and B) Permeabilized HeLa cells stably expressing GFP-T2 were incubated with GTPγS and 4 mg/ml cytosol containing the indicated concentration of R→A, the alanine-substituted peptide (A), or wt, the wild-type GalNAcT2 cytoplasmic domain peptide (B). COPII assembly, based on Sec13, was then quantified in T2-GFP–overexpressing cells and adjacent non- or low-expressing cells (mean ± SEM; >20 cells each). Representative images are presented in Fig. S2 (available at
http://www.jcb.org/cgi/content/full/jcb.200604058/DC1
). In contrast to the control, the GalNAcT2 peptide blocked the enhanced COPII assembly induced by GFP-T2 overexpression.
Figure 7.
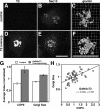
GalNAcT2 up-regulates COPII assembly and Golgi size. (A–F) Stable HeLa cell lines expressing T2-GFP were paraformaldehyde-fixed and analyzed to reveal GFP fluorescence (A and D) and Sec13 staining (B and E), each shown as Z axis projections of optical sections, as well as giantin staining (C and F) shown after 3D rendering. Control cells were those that expressed little or no detectable expression, whereas T2-GFP–overexpressing cells yielded strong Golgi and detectable ER staining. Bars, 10 μm. (G) COPII assembly and Golgi size were quantified for control and overexpressing T2-GFP cells. Values are normalized means (± SEM; n = 4; >25 cells each). Golgi size was total volume occupied by above-threshold fluorescence of giantin divided by apparent cell volume and showed a significant increase in T2-GFP–overexpressing cells. (H) COPII assembly level and the Golgi/cell size ratio were also compared on a cell-by-cell basis for single experiments. The correlation plot yielded a slope of 0.2.
Figure 8.
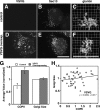
VSVG up-regulates COPII assembly but not Golgi size. (A–F) Stable HeLa cell lines expressing VSVG-GFP were paraformaldehyde-fixed and analyzed to reveal GFP fluorescence (A and D) and Sec13 staining (B and E), each shown as Z axis projections of optical sections, as well as giantin staining (C and F) shown after 3D rendering. In contrast to control cells, VSVG-GFP–overexpressing cells yielded strong apparent ER and surface staining. Bar, 10 μm. (G) COPII assembly and Golgi size were quantified for control and overexpressing VSVG-GFP (G) cells. Values are normalized means (± SEM; n = 4; >25 cells each). Although COPII assembly increased in VSVG-GFP–expressing cells, Golgi size did not. (H) COPII assembly level and the Golgi/cell size ratio were also compared on a cell-by-cell basis for single experiments. The correlation plot yielded a slope of only 0.08.
Figure 9.
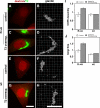
Sar1p–GalNAcT2 interaction underlies Golgi size increase. (A–H) HeLa cells stably transfected with T2-GFP were microinjected with the alanine-substituted control peptide (A–D; R→A) or the GalNAcT2 cytoplasmic domain peptide (E–H; wild type [wt]) at 1 mM in the presence of fluorescent dextran as a microinjection marker. After 45 min, the cells were paraformaldehyde-fixed and analyzed to reveal dextran and GFP fluorescence (red and green, respectively; A, C, E, and G), as well as giantin staining shown after 3D rendering (B, D, F, and H). Control cells were those that exhibited little or no detectable expression, whereas T2-GFP–overexpressing cells yielded strong Golgi and detectable ER staining. Bars, 10 μm. (I and J) COPII assembly (I) and Golgi size (J) were then quantified for all control or T2-GFP–overexpressing microinjected cells. Values are normalized means (± SD; n = 2; ≥12 cells each). Note that the GalNAcT2 peptide, but not the control peptide, blocked both the up-regulation of COPII assembly and the increase in Golgi size induced by T2-GFP.
Figure 10.
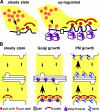
Model depicting variable exit rate mechanism. (A) COPII assembly is shown at steady state and after up-regulation by increased availability of Golgi residents in the ER membrane. The dibasic signal in the cytoplasmic domain of Golgi residents recruits more Sar1p-GDP to the ER membrane. After nucleotide exchange catalyzed by Sec12p and assembly of the prebudding complex, lateral interactions of the coat components leads to new and larger exit site formation. (B) Golgi input/output pathways are schematized before (steady state) or after either increased Golgi resident expression (Golgi growth) or increased plasma membrane protein expression (PM growth). Golgi residents up-regulate COPII assembly, leading to increased ER exit (denoted by larger arrow) and Golgi growth. Plasma membrane proteins up-regulate both ER exit and Golgi exit, leading to, at most, a transient increase in Golgi size.
Similar articles
- Sit4p/PP6 regulates ER-to-Golgi traffic by controlling the dephosphorylation of COPII coat subunits.
Bhandari D, Zhang J, Menon S, Lord C, Chen S, Helm JR, Thorsen K, Corbett KD, Hay JC, Ferro-Novick S. Bhandari D, et al. Mol Biol Cell. 2013 Sep;24(17):2727-38. doi: 10.1091/mbc.E13-02-0114. Epub 2013 Jul 17. Mol Biol Cell. 2013. PMID: 23864707 Free PMC article. - Dynamics of COPII vesicles and the Golgi apparatus in cultured Nicotiana tabacum BY-2 cells provides evidence for transient association of Golgi stacks with endoplasmic reticulum exit sites.
Yang YD, Elamawi R, Bubeck J, Pepperkok R, Ritzenthaler C, Robinson DG. Yang YD, et al. Plant Cell. 2005 May;17(5):1513-31. doi: 10.1105/tpc.104.026757. Epub 2005 Apr 1. Plant Cell. 2005. PMID: 15805489 Free PMC article. - Endoplasmic reticulum export sites and Golgi bodies behave as single mobile secretory units in plant cells.
daSilva LL, Snapp EL, Denecke J, Lippincott-Schwartz J, Hawes C, Brandizzi F. daSilva LL, et al. Plant Cell. 2004 Jul;16(7):1753-71. doi: 10.1105/tpc.022673. Epub 2004 Jun 18. Plant Cell. 2004. PMID: 15208385 Free PMC article. - Vesicle-mediated export from the ER: COPII coat function and regulation.
D'Arcangelo JG, Stahmer KR, Miller EA. D'Arcangelo JG, et al. Biochim Biophys Acta. 2013 Nov;1833(11):2464-72. doi: 10.1016/j.bbamcr.2013.02.003. Epub 2013 Feb 15. Biochim Biophys Acta. 2013. PMID: 23419775 Free PMC article. Review. - COPII-coated vesicles: flexible enough for large cargo?
Fromme JC, Schekman R. Fromme JC, et al. Curr Opin Cell Biol. 2005 Aug;17(4):345-52. doi: 10.1016/j.ceb.2005.06.004. Curr Opin Cell Biol. 2005. PMID: 15975775 Review.
Cited by
- Regulation of late endosomal/lysosomal maturation and trafficking by cortactin affects Golgi morphology.
Kirkbride KC, Hong NH, French CL, Clark ES, Jerome WG, Weaver AM. Kirkbride KC, et al. Cytoskeleton (Hoboken). 2012 Sep;69(9):625-43. doi: 10.1002/cm.21051. Epub 2012 Jul 31. Cytoskeleton (Hoboken). 2012. PMID: 22991200 Free PMC article. - Molecular mechanisms that regulate export of the planar cell-polarity protein Frizzled-6 out of the endoplasmic reticulum.
Tang X, Zhang L, Ma T, Wang M, Li B, Jiang L, Yan Y, Guo Y. Tang X, et al. J Biol Chem. 2020 Jul 3;295(27):8972-8987. doi: 10.1074/jbc.RA120.012835. Epub 2020 May 6. J Biol Chem. 2020. PMID: 32376691 Free PMC article. - Nε-lysine acetylation in the endoplasmic reticulum - a novel cellular mechanism that regulates proteostasis and autophagy.
Farrugia MA, Puglielli L. Farrugia MA, et al. J Cell Sci. 2018 Nov 16;131(22):jcs221747. doi: 10.1242/jcs.221747. J Cell Sci. 2018. PMID: 30446507 Free PMC article. Review. - Golgi enlargement in Arf-depleted yeast cells is due to altered dynamics of cisternal maturation.
Bhave M, Papanikou E, Iyer P, Pandya K, Jain BK, Ganguly A, Sharma C, Pawar K, Austin J 2nd, Day KJ, Rossanese OW, Glick BS, Bhattacharyya D. Bhave M, et al. J Cell Sci. 2014 Jan 1;127(Pt 1):250-7. doi: 10.1242/jcs.140996. Epub 2013 Nov 4. J Cell Sci. 2014. PMID: 24190882 Free PMC article. - The cargo receptors Surf4, endoplasmic reticulum-Golgi intermediate compartment (ERGIC)-53, and p25 are required to maintain the architecture of ERGIC and Golgi.
Mitrovic S, Ben-Tekaya H, Koegler E, Gruenberg J, Hauri HP. Mitrovic S, et al. Mol Biol Cell. 2008 May;19(5):1976-90. doi: 10.1091/mbc.e07-10-0989. Epub 2008 Feb 20. Mol Biol Cell. 2008. PMID: 18287528 Free PMC article.
References
- Antonny, B., D. Madden, S. Hamamoto, L. Orci, and R. Schekman. 2001. Dynamics of the COPII coat with GTP and stable analogues. Nat. Cell Biol. 3:531–537. - PubMed
- Aridor, M., and L.M. Traub. 2002. Cargo selection in vesicular transport: the making and breaking of a coat. Traffic. 3:537–546. - PubMed
- Aridor, M., S.I. Bannykh, T. Rowe, and W.E. Balch. 1999. Cargo can modulate COPII vesicle formation from the endoplasmic reticulum. J. Biol. Chem. 274:4389–4399. - PubMed


