Expression of the human PAC1 receptor leads to dose-dependent hydrocephalus-related abnormalities in mice - PubMed (original) (raw)
Expression of the human PAC1 receptor leads to dose-dependent hydrocephalus-related abnormalities in mice
Bing Lang et al. J Clin Invest. 2006 Jul.
Abstract
Hydrocephalus is a common and potentially devastating birth defect affecting the CNS, and its relationship with G protein-coupled receptors (GPCRs) is unknown. We have expressed 2, 4, or 6 copies of a GPCR--the human PAC1 receptor with a 130-kb transgene in the mouse nervous system in a pattern closely resembling that of the endogenous gene. Consistent with PAC1 actions, PKA and PKC activity were elevated in the brains of Tg mice. Remarkably, Tg mice developed dose-dependent hydrocephalus-like characteristics, including enlarged third and lateral ventricles and reduced cerebral cortex, corpus callosum, and subcommissural organ (SCO). Neuronal proliferation and apoptosis were implicated in hydrocephalus, and we observed significantly reduced neuronal proliferation and massively increased neuronal apoptosis in the developing cortex and SCO of Tg embryos, while neurite outgrowth and neuronal migration in vitro remain uncompromised. Ventricular ependymal cilia are crucial for directing cerebrospinal fluid flow, and ependyma of Tg mice exhibited disrupted cilia with increased phospho-CREB immunoreactivity. These data demonstrate that altered neuronal proliferation/apoptosis and disrupted ependymal cilia are the main factors contributing to hydrocephalus in PAC1-overexpressing mice. This is the first report to our knowledge demonstrating that misregulation of GPCRs can be involved in hydrocephalus-related neurodevelopmental disorders.
Figures
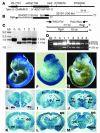
Figure 1. Genomic organization and expression of the human ADCYAP1R1 transgene.
(A) Mapping of the human ADCYAP1R1 gene encoding the PAC1 receptor to 7p between STS markers sWss1736 and D7S2679. (B) Overlapping of 221D1 with 204D22 at the 3′ half of the PAC1 receptor coding region. (C) Determination of transgene copy number by semiquantitative PCR with primers PAC1For and PAC1Rev. The ratios of the 1.8-kb band (human) to the 1.4-kb fragment (mouse) indicated that Tg1 (lane 1), Tg2 (lane 2), and Tg3 (lane 3) contained 6, 4, and 2 copies of the transgene, respectively. (D) The expression of the human PAC1 mRNA in E10.5 mouse embryos detected by RT-PCR with the primers PAC1For and PAC1Rev. RsaI restriction digestion of the PCR products resulted in 314-bp and 232-bp bands from human and mouse PAC1 mRNA, respectively. Human fetal cDNA (h) was included as a control. m, mouse. (E–G) X-gal staining of E10.5 mouse embryos derived from lines Tg1 (E), Tg2 (F), and Tg3 (G), revealing transgene expression in the nervous system. (H–M) X-gal staining of coronal sections of adult brains, showing high levels of transgene expression in anterodorsal thalamic nucleus (AD; J), anterior hypothalamic nucleus (AHA; L), amygdala (Amg; M), anterior olfactory nucleus (Ao; H), anteroventral thalamic nucleus (AV; J), cingulate cortex (Cg; I), dentate gyrus (DG; K and M), frontal cortex (Fr; I), piriform cortex (Pir; J), paraventricular nucleus of the thalamus (Pv; J), reuniens thalamic nucleus (Re; J), and ventricular ependymal layer (vel; I, K and M).
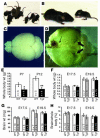
Figure 2. Growth retardation and hydrocephalus in PAC1-overexpressing mice.
(A) A litter of P12 Tg3 heterozygote × heterozygote mice showed marked variation in body size. (B) The smallest littermate (right) weighed approximately a quarter of the normal weight (left) and displayed a mildly dome-shaped skull, typical of a progressive hydrocephalus phenotype. (C and D) Images of the same magnification of brains were taken from a 5-week-old WT (C) and a Tg3 homozygotic littermate (D), and the latter manifested severe hydrocephalus with unfused frontal cortex (thin arrow) and dramatically thinned occipital and parietal cortex (thick arrows). (E) The growth of Tg2 mice was significantly retarded by P7 and P12. (F) Tg1 but not Tg3 newborns were significantly smaller than their WT littermates at E19.5; however, the difference was marginal at E17.5. Neither Tg3 nor Tg1 transgenics differed significantly from their WT littermates in brain weight (G) or ratios of brain to whole-body weight (H) at E17.5 or E19.5. *P <0.05; **P <0.01.
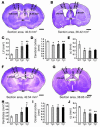
Figure 3. Morphometric evidence showing dose-dependent hydrocephalus in PAC1 Tg mice.
(A, B, F, and G). Coronal sections of adult brains from WT (A and F) and Tg (B and G) mice were stained with cresyl violet. The sizes of ventricles (C and H), the thickness of the cerebral cortex (D and I) and of the cc (E and J), as well as the section area were quantified by AxioVision Rel. 4.5 (Zeiss) at comparable planes across the anterior commissure (ac; A and B) or optic chiasm (ox; F and G) from 5 WT and 3 Tg mice of each line. Note transgene dosage–dependent dilation of the LVs (C and H) and significant reduction of the cerebral cortex (D and I) and cc (E and J). *P <0.05; **P <0.01. Scale bars: 1 mm in A, B, F, and G.
Figure 4. Reduced SCO and dilated third ventricle (3V) and aqueduct in Tg mice.
(A–D) Coronal sections across the optic chiasm showed an enlarged third ventricle (3V) in each of the 3 Tg lines (B–D) compared with their WT (A) littermates. (E–H) Comparison of coronal sections at the ventral tegmental decussation level displayed dilated aqueduct in all 3 Tg lines (F–H), with a morphology grossly different from that in the WT littermates (E). (I–L) Images of coronal sections at the posterior commissure (pc) level revealed reduced SCO in all 3 Tg lines (J–L) in comparison to the WT littermates (I). Sections in A–C, F, and I were stained with cresyl violet; sections in E, G, J, and K with H&E; and sections in D, H, and L with X-gal and neutral red. Note transgene expression in the ependymal cells (vel) of the third ventricle (D and L) and aqueduct (H) and in the SCO (arrow, L). (M) The SCO cell numbers at the pc level were significantly reduced in Tg2 and Tg1 mice. *P <0.05. Aq, aqueduct. Scale bars: 100 μm in A–D and I–L; 50 μm in E–H.
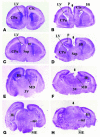
Figure 5. Congenital brain abnormalities in PAC1 Tg mice.
Nissl staining of serial coronal sections in a rostral-to-caudal direction from P1 WT (A, C, E, and G) and Tg (B, D, F, and H) mice. Tg mice manifested a number of abnormalities, including dilated LVs, thinned cortex (Ctx), uncrossed cc and formation of Probst bundles (p), widened longitudinal fissure between the 2 hemispheres (arrows), and rostralization together with underdevelopment of the hippocampus (Hi). CPu, caudate putamen; MD, mediodorsal thalamus; ME, median eminence; mt, mammillothalamic tract; Sep, septum.
Figure 6. Tg mice are defective in cortical lamination but less likely defective in axonal guidance.
(A and B) Nissl staining of coronal brain sections of WT (inset, A) and Tg (inset, B) littermates revealed dilated ventricles. Magnified images of the boxed regions shown in the insets of A and B illustrate thinned cerebral cortex and cc. Note that layer V was significantly reduced, with fewer large neurons (pyramidal). (C) X-gal staining showed transgene expression largely at layers V and VI. (D and E) Glial fibrillary acidic protein (GFAP) immunostaining of brains of P1 WT mice (D) and Tg littermates (E) demonstrating a similar staining pattern at the glial wedge (black boxes) and the indusium griseum (arrows), magnified in the insets. Note that the thickness of cc (delineated by vertical lines) was also reduced in Tg newborns. F and G show magnification of the glial wedges delineated by the black boxes in D and E, revealing slightly more glial staining in Tg mice (G). Scale bars: 200 μm in A–E; 50 μm in F and G and insets of D and E; 1 mm in insets of A–C.
Figure 7. Decreased proliferation and increased apoptosis in E15.
Tg embryos. (A–D) BrdU labeling of transverse sections of E15.5 Tg embryos and WT littermates. C and D are higher-power views of the boxed areas in A and B, respectively. Note the substantial reduction in BrdU incorporation in Tg embryos. (E and F) TUNEL assay of coronal sections of E15.5 WT (E) and Tg (F) embryos, demonstrating remarkable increases in apoptosis in the developing SCO (boxed areas, arrows), cortex (cortical plate and marginal zone in particular), and ventricular ependymal cells (arrowheads) in Tg embryos. (G and H) Higher magnification of the SCO in E and F. TUNEL-labeled cells (I) in E15.5 cortex were quantified from 0.038 mm2 of 3 sections of each embryo (WT, n = 4; Tg, n = 4). The number of BrdU-positive cells (J) or the total number of cells (J) and their ratios (K) within 0.01 mm2 of the proliferating zones of E15.5 cortex were quantified from 5 WT and 5 Tg embryos, showing significantly reduced neuronal proliferation. **P <0.01. CsL, corpus striatum laterale; CsM, corpus striatum mediale. Scale bars: 400 μm in A, B, E, and F; 100 μm in C, D, G, and H.
Figure 8. Neurogenesis but not oligodendrocyte generation is affected by PAC1 overexpression.
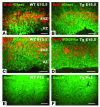
(A and B) Double immunostaining of E15.5 cortex with BrdU (red) and GLAST (green) showed reduced BrdU labeling in the subventricular zone (SVZ) of developing cortex of Tg embryos (B) compared with that in the WT control (A). Note that most, if not all, of the BrdU-labeled cells coexpressed GLAST. (C and D) Colabeling of E15.5 cortex with BrdU and PDGFRα. Cells in the ventricular zone (VZ) and SVZ at this stage were weakly stained with anti-PDGFRα, indicating they are multipotential neural stem cells. No significant difference in PDGFRα staining was observed at E15.5 in cortex of WT and Tg embryos. (E and F) Immunostaining of Sox10 showed comparable labeling of Sox10-positive cells in P12 striatum of WT (E) and Tg (F) littermates. Scale bars: 50 μm in A–F.
Figure 9. PACAP promotes neurite outgrowth and migration in neurons of Tg embryos.
At E15.5, neurons from developing cortex of Tg or WT embryos were cultured on 35-mm dishes at a density of 104 cells/ml in the absence (A and C) or presence (B and D) of PACAP (10–7 M) for 4 hours prior to recording. Migrational behavior was recorded with time-lapse imaging for the subsequent 8 hours, and migration rates of 100–120 cells under each condition from 3 independent experiments were quantified by 1-way ANOVA (*P <0.05) (E). Note that (a) PACAP promotes neurite outgrowth in neurons of both WT and Tg embryos (B and D) and (b) PACAP significantly increases the migration rate of neurons of Tg embryos (E).
Figure 10. Disorganized cilia in ventricular ependyma but not in choroid plexus of Tg mice.
Brains from three 5-week-old Tg2 mice (C–E, G, and I) and 2 WT (A, B, F, and H) littermates were coronally sectioned. Sections were costained with Hoechst (blue), anti–acetylated α-tubulin (red), and anti-Polaris (green) (A–E, H, and I) or stained with anti–phospho-CREB (F and G). Insets in B, D, H, and I are magnified views of cilia (arrowheads) in the respective panels. Note that ependyma of Tg mice exhibited disorganized cilia and increased phospho-CREB reactivity. Scale bars: 50 μm in A–I and 5 μm in insets of B, D, H, and I.
Figure 11. Elevated PKA and PKC activity in PAC1-overexpressing mice.
Proteins were extracted from brains of WT (lane 1), Tg3 (lane 2), Tg2 (lane 3), and Tg1 (lane 4) mice. (A) One hundred micrograms of total proteins were resolved by SDS-PAGE and sequentially probed with Abs against phospho-CREB (p-CREB), total CREB, and tubulin. (B) Thirty-five micrograms of proteins were run on SDS-PAGE and sequentially immunoblotted with Abs against phospho-MARCKS (p-MARCKS), total MARCKS, and tubulin. The relative abundance of proteins CREB and phospho-CREB (C) or MARCKS and phospho-MARCKS (D) was quantified from 4 independent immunoblots.
Comment in
- Neuropeptide signaling and hydrocephalus: SCO with the flow.
Picketts DJ. Picketts DJ. J Clin Invest. 2006 Jul;116(7):1828-32. doi: 10.1172/JCI29148. J Clin Invest. 2006. PMID: 16823482 Free PMC article.
Similar articles
- Neuropeptide signaling and hydrocephalus: SCO with the flow.
Picketts DJ. Picketts DJ. J Clin Invest. 2006 Jul;116(7):1828-32. doi: 10.1172/JCI29148. J Clin Invest. 2006. PMID: 16823482 Free PMC article. - Pro- and anti-mitogenic actions of pituitary adenylate cyclase-activating polypeptide in developing cerebral cortex: potential mediation by developmental switch of PAC1 receptor mRNA isoforms.
Yan Y, Zhou X, Pan Z, Ma J, Waschek JA, DiCicco-Bloom E. Yan Y, et al. J Neurosci. 2013 Feb 27;33(9):3865-78. doi: 10.1523/JNEUROSCI.1062-12.2013. J Neurosci. 2013. PMID: 23447598 Free PMC article. - Loss of p73 in ependymal cells during the perinatal period leads to aqueductal stenosis.
Fujitani M, Sato R, Yamashita T. Fujitani M, et al. Sci Rep. 2017 Sep 20;7(1):12007. doi: 10.1038/s41598-017-12105-z. Sci Rep. 2017. PMID: 28931858 Free PMC article. - PACAP and PAC1 receptor in brain development and behavior.
Shen S, Gehlert DR, Collier DA. Shen S, et al. Neuropeptides. 2013 Dec;47(6):421-30. doi: 10.1016/j.npep.2013.10.005. Epub 2013 Oct 23. Neuropeptides. 2013. PMID: 24220567 Review. - The secretory ependymal cells of the subcommissural organ: which role in hydrocephalus?
Meiniel A. Meiniel A. Int J Biochem Cell Biol. 2007;39(3):463-8. doi: 10.1016/j.biocel.2006.10.021. Epub 2006 Nov 2. Int J Biochem Cell Biol. 2007. PMID: 17150405 Review.
Cited by
- PAC1R agonist maxadilan enhances hADSC viability and neural differentiation potential.
Guo X, Yu R, Xu Y, Lian R, Yu Y, Cui Z, Ji Q, Chen J, Li Z, Liu H, Chen J. Guo X, et al. J Cell Mol Med. 2016 May;20(5):874-90. doi: 10.1111/jcmm.12772. Epub 2016 Jan 22. J Cell Mol Med. 2016. PMID: 26798992 Free PMC article. - Camel regulates development of the brain ventricular system.
Yang S, Emelyanov A, You MS, Sin M, Korzh V. Yang S, et al. Cell Tissue Res. 2021 Feb;383(2):835-852. doi: 10.1007/s00441-020-03270-1. Epub 2020 Sep 9. Cell Tissue Res. 2021. PMID: 32902807 Free PMC article. - Increased pituitary adenylate cyclase-activating peptide genes expression in the prefrontal cortex in schizophrenia in relation to suicide.
Slabe Z, Balesar RA, Verwer RWH, Drevenšek G, Swaab DF. Slabe Z, et al. Front Mol Neurosci. 2023 Nov 2;16:1277958. doi: 10.3389/fnmol.2023.1277958. eCollection 2023. Front Mol Neurosci. 2023. PMID: 38025265 Free PMC article. - Neuroleptic Drugs and PACAP Differentially Affect the mRNA Expression of Genes Encoding PAC1/VPAC Type Receptors.
Jóźwiak-Bębenista M, Kowalczyk E. Jóźwiak-Bębenista M, et al. Neurochem Res. 2017 Apr;42(4):943-952. doi: 10.1007/s11064-016-2127-2. Epub 2016 Nov 30. Neurochem Res. 2017. PMID: 27900577 Free PMC article.
References
- Galarza M. Evidence of the subcommissural organ in humans and its association with hydrocephalus. Neurosurg. Rev. 2002;25:205–215. - PubMed
Publication types
MeSH terms
Substances
Grants and funding
- BB/D004659/1/BB_/Biotechnology and Biological Sciences Research Council/United Kingdom
- G0701003/MRC_/Medical Research Council/United Kingdom
- G9719726/MRC_/Medical Research Council/United Kingdom
LinkOut - more resources
Full Text Sources
Medical
Molecular Biology Databases
Miscellaneous
