Monoamine oxidase A and repressor R1 are involved in apoptotic signaling pathway - PubMed (original) (raw)
Monoamine oxidase A and repressor R1 are involved in apoptotic signaling pathway
Xiao-Ming Ou et al. Proc Natl Acad Sci U S A. 2006.
Abstract
Monoamine oxidase A (MAO A) degrades serotonin, norepinephrine, and dopamine and produces reactive oxygen that may cause neuronal cell death. We have previously reported that a novel transcription factor R1 (RAM2/CDCA7L/JPO2) inhibits the MAO A promoter and enzymatic activities. This study reports the roles of MAO A and R1 in apoptosis and proliferation. We have found that in serum starvation-induced apoptosis, p38 kinase, MAO A, and caspase-3 were increased, whereas Bcl-2 and R1 were reduced. Using a p38 kinase inhibitor, R1 overexpression, and MAO A inhibitor, we have shown that MAO A and R1 are downstream of p38 kinase and Bcl-2, but upstream of caspase-3. Inhibition of MAO A prevents cell apoptosis. This notion was further supported by the finding that serum starvation-induced apoptosis is reduced in cortical brain cells from MAO A-deficient mice compared with WT. In addition, we found that MAO A and R1 are involved in the c-Myc-induced proliferative signaling pathway in the presence of serum. Immunoprecipitation and immunohistochemistry experiments indicate that the oncogene c-Myc colocalizes with R1 and induces R1 gene expression. Using R1 overexpression, R1 small interfering RNA, and a MAO A inhibitor, we found that R1 and MAO A act upstream of cyclin D1 and E2F1. In summary, this study demonstrates the functions of MAO A and its repressor R1 in apoptotic signaling pathways.
Conflict of interest statement
Conflict of interest statement: No conflicts declared.
Figures
Fig. 1.
Effects of serum starvation-induced apoptosis on repressor R1 or MAO A expression in SK-N-BE(2)-C cells. Cells were cultured in serum-withdrawal medium for 1, 2, or 3 days. (A) Cell proliferation rate was determined by MTT assay. (B) mRNA level of R1 was examined by real-time RT–PCR. (C and D) MAO A activity was determined by real-time RT–PCR (C) or enzymatic activity assay (D). Values were obtained on serum starvation days 1, 2, and 3 and compared with their respective controls (in the presence of serum), which were taken as 100%. All data are presented as the mean ± SD of at least three independent experiments.
Fig. 2.
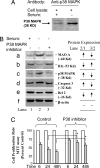
Repressor R1 and MAO A are present in the MAPK signaling pathway in serum starvation-induced apoptosis in SK-N-BE(2)-C cells. (A) Western blot analysis showed that p38 kinase is involved in serum starvation-induced apoptosis. (B) p38 kinase inhibitor prevented an increase in MAO A and decrease in R1 during serum starvation. p38 kinase inhibitor (PD169316, 1 μM) was added into serum-free medium for 3 days. Western blot analysis shows the protein expression of MAO A (a), R1 (b), p38 kinase (c), apoptotic marker protein caspase-3 (d), antiapoptotic marker protein Bcl-2 (e), and β-actin (loading control) (f) in control medium (lanes 1), serum-free medium (lanes 2), and serum-free medium plus p38 kinase inhibitor (lanes 3). The relative changes of protein expression are shown by arrows. (C) p38 kinase inhibitor prevented the decrease of proliferation rate induced by serum starvation. MTT assay was performed to determine the proliferation rate between serum-free medium and serum-free plus p38 kinase inhibitor group at different serum starvation time courses, 6, 24, or 48 h. Values at each time point were obtained by comparison with their respective controls (in the presence of serum), which were taken as 100%. The percentage of decrease was compared between the serum starvation group and the serum-free plus p38 kinase inhibitor group as indicated.
Fig. 3.
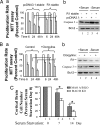
Effects of overexpression of R1 or inhibition/deficiency of MAO A on serum starvation-induced apoptosis. (A) Overexpressed R1 prevented the apoptosis. (a) R1-stable cell lines showed the prevention of decreased proliferation. MTT assay was performed to determine the proliferation rate between pcDNA3.1-stable and R1-stable cells at different serum starvation time courses, 6, 24, or 48 h. Values were obtained by comparing these cells with their respective controls (in the presence of serum), which were taken as 100% and then further compared between pcDNA3.1-stable cell lines and R1-stable cell lines in serum starvation-induced apoptosis as indicated. (b) R1-stable cells prevented the increased caspase-3 but did not prevent the decreased Bcl-2. Western blot analysis showed the protein expression of caspase-3 and Bcl-2 in pcDNA3.1-stable cells (lanes 1 and 3) or R1-stable cells (lanes 2 and 4) in the presence (lanes 1 and 2) or absence (lanes 3 and 4) of serum. (B) MAO A inhibitor (clorgyline) prevented the apoptosis. (a) MAO A inhibitor prevented the decreased cell proliferation rate. MTT assay was performed to determine the cell proliferation rate between the vehicle-treated group and clorgyline (10−7 M)-treated group at different serum starvation time courses, 6, 24, or 48 h. Values were obtained and compared with their respective controls (in the presence of serum), which were taken as 100% and then further compared between the vehicle-treated group and the clorgyline-treated group in serum starvation-induced apoptosis as indicated. (b) MAO A inhibitor clorgyline (10−7 M; 48 h; lanes 2 and 4) prevented the increase in caspase-3 but did not prevent the decrease in Bcl-2 in serum starvation-induced apoptosis (lanes 3 and 4) as determined by Western blot. (C) The effect of MAO A deficiency on the apoptosis of cortical brain cells. Primary cortical brain cells were isolated from either MAO A/B double KO (lanes 1, 3, and 5) or MAO B KO mice (lanes 2, 4, and 6) and plated in a six-well plate. On day 7, medium was replaced by serum-free medium. Cell numbers in each well were counted on serum starvation days 0, 7, and 14. The cell number before serum starvation (serum starvation day 0) was designated as 100% (lanes 1 and 2). Results are the mean ± SD of data by taking the average of triplicates from each mouse for three mice in each genotype.
Fig. 4.
Effects of R1-siRNA on proliferation and MAO A expression. (A) R1-siRNA knockdown decreased proliferation in UW228 cells. MTT assay was performed to determine the proliferation rate between WT and R1 knockdown cells (the human medulloblastoma UW228) on days 2 and 3. Values of decrease in proliferation rate were obtained by comparing MTT values of days 2 or 3 with that of day 1, which was taken as 100% in both WT and R1-siRNA knockdown cells. The percentage decrease of days 2 or 3 as compared with day 1 in each group is shown. R1-siRNA knockdown increased MAO A activity in UW228 cells, which were grown for 3 days. (B and C) MAO A activity was determined by real-time RT–PCR (B) and enzymatic activity assay (C). Values were obtained by comparing R1 knockdown cells with WT cells, which were taken as 100%.
Fig. 5.
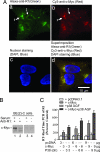
The interaction of R1 with c-Myc in SK-N-BE(2)-C cells. (A) R1 was colocalized with c-Myc as demonstrated by immunofluorescence. (a and b) SK-N-BE(2)-C cells were plated on a four-well chamber slide the day before experiment and then fixed and incubated with rabbit anti-R1-antibody (a) or mouse anti-c-Myc antibody (b) followed by fluorescein-conjugated anti-rabbit (green, a) or anti-mouse (red, b) secondary antibody. (c) The stained slides were mounted in the presence of DAPI for nuclear staining (blue). (d) The merged images of R1 (green), c-Myc (red), and nucleus (blue) is shown. (B) R1 interacted with c-Myc as determined by coimmunoprecipitation assay. Nuclear proteins isolated from cells that were cultured in the presence (lanes 1 and 3) or absence (lanes 2 and 4) of serum were immunoprecipitated by incubating with (lanes 1 and 2) or without (lanes 3 and 4) anti-R1 antibody. Protein coimmunoprecipitation with R1 was analyzed by Western blot using anti-c-Myc antibody. (C) c-Myc and dominant negative p38 (p38-AGF) up-regulate R1 mRNA expression. Cells were seeded in a 10-cm dish and transiently transfected with different concentrations of c-MycER, p38-AGF, or both for 48 h. The R1 mRNA level was determined by real-time RT–PCR. Controls were cotransfected with pc-DNA3.1, which was taken as 100%.
Fig. 6.
Effects of R1, c-MycER, and MAO A inhibitor on gene expression of MAO A, E2F1, and cyclin D1. (A) R1 or c-MycER decreased MAO A expression. (a) R1 or c-MycER decreased MAO A promoter activity as determined by transient transfection and luciferase assay. The MAO A 2-kb promoter-luciferase construct was cotransfected with R1, c-MycER, or both into SK-N-BE(2)-C cells for 48 h. Cells were harvested, and luciferase activity was determined. (b and c) R1 or c-MycER decreased MAO A mRNA level (b) or increased E2F1 or cyclin D1 mRNA level (c) as determined by real-time RT–PCR. R1 or c-MycER was transfected into SK-N-BE(2)-C cells for 48 h. Then mRNA was extracted and subjected to real-time RT–PCR analysis. Controls were cotransfected with pc-DNA3.1, which was taken as 100%. (B) The effect of MAO A on gene expression of E2F1 and cyclin D1. Cells were treated with MAO A inhibitor clorgyline (10−7 M; 48 h), and the mRNA levels of E2F1 and cyclin D1 were determined by real-time RT–PCR. Controls were treated with vehicle, which was taken as 100%.
Fig. 7.
Proposed signaling pathways of MAO- A and R1-mediated apoptosis in the human neuroblastoma SK-N-BE(2)-C cells. Arrows and dashed lines indicate activation and repression of the following targets, respectively.
Similar articles
- Monoamine oxidase-A modulates apoptotic cell death induced by staurosporine in human neuroblastoma cells.
Fitzgerald JC, Ufer C, De Girolamo LA, Kuhn H, Billett EE. Fitzgerald JC, et al. J Neurochem. 2007 Dec;103(6):2189-99. doi: 10.1111/j.1471-4159.2007.04921.x. Epub 2007 Sep 18. J Neurochem. 2007. PMID: 17883400 - Pro-apoptotic gene expression mediated by the p38 mitogen-activated protein kinase signal transduction pathway.
De Zutter GS, Davis RJ. De Zutter GS, et al. Proc Natl Acad Sci U S A. 2001 May 22;98(11):6168-73. doi: 10.1073/pnas.111027698. Epub 2001 May 8. Proc Natl Acad Sci U S A. 2001. PMID: 11344273 Free PMC article. - Monoamine oxidases in major depressive disorder and alcoholism.
Duncan J, Johnson S, Ou XM. Duncan J, et al. Drug Discov Ther. 2012 Jun;6(3):112-22. Drug Discov Ther. 2012. PMID: 22890201 Review.
Cited by
- Sex hormones affect neurotransmitters and shape the adult female brain during hormonal transition periods.
Barth C, Villringer A, Sacher J. Barth C, et al. Front Neurosci. 2015 Feb 20;9:37. doi: 10.3389/fnins.2015.00037. eCollection 2015. Front Neurosci. 2015. PMID: 25750611 Free PMC article. Review. - Nutrient/serum starvation derived TRIP-Br3 down-regulation accelerates apoptosis by destabilizing XIAP.
Li C, Jung S, Lee S, Jeong D, Yang Y, Kim KI, Lim JS, Cheon CI, Kim C, Kang YS, Lee MS. Li C, et al. Oncotarget. 2015 Apr 10;6(10):7522-35. doi: 10.18632/oncotarget.3112. Oncotarget. 2015. PMID: 25691055 Free PMC article. - Assessment of Enzyme Inhibition: A Review with Examples from the Development of Monoamine Oxidase and Cholinesterase Inhibitory Drugs.
Ramsay RR, Tipton KF. Ramsay RR, et al. Molecules. 2017 Jul 15;22(7):1192. doi: 10.3390/molecules22071192. Molecules. 2017. PMID: 28714881 Free PMC article. Review. - Monoamine oxidase A expression is suppressed in human cholangiocarcinoma via coordinated epigenetic and IL-6-driven events.
Huang L, Frampton G, Rao A, Zhang KS, Chen W, Lai JM, Yin XY, Walker K, Culbreath B, Leyva-Illades D, Quinn M, McMillin M, Bradley M, Liang LJ, DeMorrow S. Huang L, et al. Lab Invest. 2012 Oct;92(10):1451-60. doi: 10.1038/labinvest.2012.110. Epub 2012 Aug 20. Lab Invest. 2012. PMID: 22906985 Free PMC article. - Monoamine oxidase-A promotes protective autophagy in human SH-SY5Y neuroblastoma cells through Bcl-2 phosphorylation.
Ugun-Klusek A, Theodosi TS, Fitzgerald JC, Burté F, Ufer C, Boocock DJ, Yu-Wai-Man P, Bedford L, Billett EE. Ugun-Klusek A, et al. Redox Biol. 2019 Jan;20:167-181. doi: 10.1016/j.redox.2018.10.003. Epub 2018 Oct 9. Redox Biol. 2019. PMID: 30336354 Free PMC article.
References
- Lan N. C., Heinzmann C., Gal A., Klisak I., Orth U., Lai E., Grimsby J., Sparkes R. S., Mohandas T., Shih J. C. Genomics. 1989;4:552–559. - PubMed
- Hauptmann N., Grimsby J., Shih J. C., Cadenas E. Arch. Biochem. Biophys. 1996;335:295–304. - PubMed
Publication types
MeSH terms
Substances
LinkOut - more resources
Full Text Sources
Other Literature Sources
Molecular Biology Databases
Research Materials


