BLOC-1 interacts with BLOC-2 and the AP-3 complex to facilitate protein trafficking on endosomes - PubMed (original) (raw)
BLOC-1 interacts with BLOC-2 and the AP-3 complex to facilitate protein trafficking on endosomes
Santiago M Di Pietro et al. Mol Biol Cell. 2006 Sep.
Abstract
The adaptor protein (AP)-3 complex is a component of the cellular machinery that controls protein sorting from endosomes to lysosomes and specialized related organelles such as melanosomes. Mutations in an AP-3 subunit underlie a form of Hermansky-Pudlak syndrome (HPS), a disorder characterized by abnormalities in lysosome-related organelles. HPS in humans can also be caused by mutations in genes encoding subunits of three complexes of unclear function, named biogenesis of lysosome-related organelles complex (BLOC)-1, -2, and -3. Here, we report that BLOC-1 interacts physically and functionally with AP-3 to facilitate the trafficking of a known AP-3 cargo, CD63, and of tyrosinase-related protein 1 (Tyrp1), a melanosomal membrane protein previously thought to traffic only independently of AP-3. BLOC-1 also interacts with BLOC-2 to facilitate Tyrp1 trafficking by a mechanism apparently independent of AP-3 function. Both BLOC-1 and -2 localize mainly to early endosome-associated tubules as determined by immunoelectron microscopy. These findings support the idea that BLOC-1 and -2 represent hitherto unknown components of the endosomal protein trafficking machinery.
Figures
Figure 1.
Coimmunoprecipitation of BLOC-1 with BLOC-2 and AP-3. (A) HeLa cells were homogenized in the absence of detergents and presence of GTPγS, and the homogenate was centrifuged to yield cytosolic and membrane fractions. The membrane fraction was solubilized in an excess of buffer containing Triton X-100, and the same detergent was added to the cytosol to match the buffer compositions (see Materials and Methods). Both fractions were subjected to immunoprecipitation (IP) using polyclonal antibodies to the dysbindin, HPS6, HPS4, and σ3 subunits of BLOC-1, BLOC-2, BLOC-3, and AP-3, respectively. Irrelevant rabbit IgG, and a polyclonal antibody that fails to recognize its cognate antigen (ε) under nondenaturing conditions, were included as controls. The immunoprecipitates, together with an aliquot of the extracts corresponding to 1% of the material available for IP, were analyzed by immunoblotting (IB) using mAbs to the pallidin, HPS4, and δ subunits of BLOC-1, BLOC-3, and AP-3, respectively, and the HP6d antibody to the HPS6 subunit of BLOC-2. The signal corresponding to 1% of AP-3 δ was detected upon longer exposures than that shown in the figure. (B) HeLa membrane extracts prepared in the presence of GTPγS or GDP were subjected to immunoprecipitation using control IgG or polyclonal antibodies against the dysbindin or BLOS3 subunits of BLOC-1. The immunoprecipitates were analyzed by immunoblotting using antibodies to subunits of BLOC-2 and AP-3. (C) Solubilized liver membranes were prepared in the presence of GTPγS from wild-type mice or from homozygous pallid (pa), cocoa (coa) and pearl (pe) mutant mice deficient in BLOC-1, BLOC-2, and AP-3, respectively. Equivalent total protein amounts of the extracts were subjected to immunoprecipitation using irrelevant rabbit IgG or purified rabbit antibodies to the dysbindin subunit of BLOC-1 or the σ3 subunit of AP-3. The immunoprecipitates were analyzed by immunoblotting using a polyclonal antibody to the β3A subunit of AP-3 and an mAb to the pallidin subunit of BLOC-1.
Figure 2.
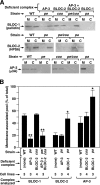
Membrane-associated pools of BLOC-1, BLOC-2 and AP-3 in fibroblasts from mutant mice. (A) Immortalized fibroblasts derived from the skin of C57BL/6J mice (WT), homozygous pallid (pa), cocoa (coa), and pearl (pe) mice deficient in BLOC-1, BLOC-2, and AP-3, respectively, and pearl/cocoa (pe/coa) double mutant mice were subjected to a quick homogenization and ultracentrifugation procedure to yield postnuclear membrane (M) and cytosolic (C) fractions (see Materials and Methods). Aliquots corresponding to an equivalent cell number were analyzed by immunoblotting using antibodies to the indicated subunits of BLOC-1, BLOC-2, and AP-3. (B) Quantification of the relative amount of each complex that was recovered from the membrane fraction. Bars, means ± SEM of the indicated number of independent fibroblast lines analyzed per strain. For each protein complex, the data groups corresponding to mutant cells were compared with that of wild-type fibroblasts by means of ANOVA followed by Dunnett’s test: *p < 0.05; **p < 0.01.
Figure 3.
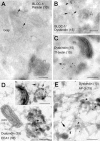
Localization of endogenous BLOC-1 in human MNT-1 cells as determined by immunoelectron microscopy. (A–C) Ultrathin cryosections of MNT1 cells were labeled with polyclonal antibodies against the pallidin (A) or dysbindin (B and C) subunits of BLOC-1 followed by protein A conjugated to 10- or 15-nm gold, as indicated. In C, cells were allowed to internalize Tf-biotin for 45 min before fixation, and Tf-biotin was subsequently detected with anti-biotin followed by protein A gold (10 nm) conjugate. Arrows point at examples of BLOC-1 labeling associated to tubulovesicular membrane profiles, some of them in the vicinity of the Golgi complex or type IV melanosomes. In C, the BLOC-1–positive tubulovesicular structures contained internalized Tf-biotin. (D and E) Immunogold labeling on whole-mounted MNT1 cells in which endosomes were selectively cross-linked with Tf-HRP. (D) BLOC-1 (arrows) was detected on endosomal tubules and occasionally vacuoles (inset) that also contained EEA1. These endosomal elements were often close to pigmented melanosomes (type III or IV). (E) BLOC-1 and AP-3 were detected in the same endosomal network, although relatively less BLOC-1 labeling was observed in AP-3–containing buds (arrowheads) than in tubules, some of which also contained AP-3 (arrow). Bars, 200 nm.
Figure 4.
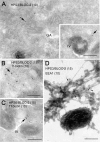
Localization of endogenous BLOC-2 in human MNT-1 cells as determined by immunoelectron microscopy. (A–C) Ultrathin cryosections of MNT-1 cells were labeled with polyclonal antibodies against the HPS3 and HPS6 subunits of BLOC-2, followed by protein A conjugated to 10- or 15-nm gold, as indicated. In B and C, cells were allowed to internalize Tf-biotin for 45 min before fixation, and Tf-biotin was subsequently detected with anti-biotin followed by protein A gold (10 nm) conjugate. BLOC-2 localized to tubulovesicular structures often close to the Golgi complex and/or melanosomes; these structures could be accessed by internalized Tf-biotin. (D) Immunogold labeling for endogenous BLOC-2 and EEA1 on whole-mounted MNT1 cells in which endosomes were selectively cross-linked with Tf-HRP. BLOC-2 (arrows) was detected on EEA1-positive endosomal tubules closely apposed to pigmented (type IV) melanosomes. Bars, 200 nm.
Figure 5.
Knockdown of AP-3 and BLOC-1 in human fibroblasts elicits surface accumulation of CD63. (A) Human M1 fibroblasts were either mock-treated (No siRNA) or treated with siRNA duplexes to target the δ subunit of AP-3, the pallidin subunit of BLOC-1, the HPS6 subunit of BLOC-2, the HPS4 subunit of BLOC-3, or to irrelevant targets (control). Whole-cell lysates were prepared and analyzed by immunoblotting using antibodies to the indicated proteins. (B–D) Representative immunofluorescence images of M1 fibroblasts treated with an irrelevant siRNA duplex (B) or with specific siRNA duplexes to knockdown expression of BLOC-1 (C) or AP-3 (D), followed by fixation/permeabilization and staining using an mAb to endogenous CD63. Notice the relatively higher levels of CD63 associated with the plasma membrane of BLOC-1– or AP-3–deficient cells, as revealed by a higher intensity of homogeneous “haze” signal amid the punctuate staining corresponding to intracellular CD63. Bar, 50 μm. (E and F) Distributions of the surface levels of CD63 (E) and TfR (F) in mock-treated (No siRNA) and siRNA-treated M1 fibroblasts, as determined by immunostaining of nonpermeabilized cells with FITC-conjugated antibodies followed by flow cytometry. The filled distributions correspond to cells immunostained using an irrelevant FITC-conjugated antibody (against goat IgG). Dashed vertical lines are placed at arbitrary positions to facilitate the visual comparison of the distributions. (G) Statistical analysis of results obtained in independent experiments in which M1 cells were treated with a control siRNA pool or with specific siRNA duplexes to target AP-3 and each of the BLOCs, followed by quantification of CD63 surface levels by flow cytometry. Values are expressed as the ratio between the mean CD63 fluorescence signal of siRNA-treated cells and that of untreated cells, which were analyzed in parallel in each experiment. Bars, means ± SEM of the indicated numbers of independent experiments (n). One-way ANOVA followed by Dunnett’s test of each group versus treatment with control pool siRNA: *p < 0.05; **p < 0.01.
Figure 6.
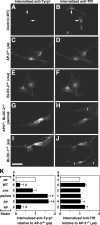
Enhanced flux of Tyrp1 internalization in primary skin melanocytes from mutant mice deficient in AP-3, BLOC-1 or BLOC-2. (A–K) Skin melanocytes were cultured from mice of the control C57BL/6J strain (WT), the homozygous mutant strains pearl (pe), pallid (pa), cocoa (coa), and pale ear (ep) deficient in AP-3, BLOC-1, BLOC-2, and BLOC-3, respectively, or from the pe/coa double mutant strain. Live cells were allowed to internalize a mouse mAb to Tyrp1 together with a rat mAb to TfR for 20 min at 37°C and subsequently were fixed/permeabilized and incubated with Cy3-conjugated anti-mouse IgG and Alexa-488–conjugated anti-rat IgG. Digital fluorescence microscopy images of internalized anti-Tyrp1 (A, C, E, G, and I) and anti-TfR (B, D, F, H, and J) were acquired and processed under identical conditions for each antibody. Bar, 25 μm. Contaminating fibroblasts (f) were present in the cultures and, as expected, internalized anti-TfR but not anti-Tyrp1. (K) The relative amounts of internalized anti-Tyrp1 and anti-TfR were estimated for each strain as the average fluorescence intensity per cell of 24–62 randomly selected melanocytes per independent culture and normalized to the average value obtained for AP-3–deficient melanocytes (□) analyzed in parallel. Solid bars represent means ± SD of the indicated number of independent cultures per strain. One-sample t test: # and *, lower and higher, respectively, than the reference value of 1 set for AP-3–deficient melanocytes, with p < 0.05.
Figure 7.
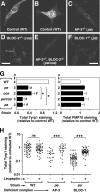
Decreased steady-state Tyrp1 protein levels in primary skin melanocytes from mutant mice deficient in AP-3, BLOC-1, or BLOC-2. Skin melanocytes were cultured from mice of the control C57BL/6J strain (WT), the homozygous mutant strains pearl (pe), pallid (pa), and cocoa (coa) deficient in AP-3, BLOC-1, and BLOC-2 respectively, or from the pe/coa double mutant strain. Cells were fixed/permeablized and stained using a mouse mAb to Tyrp1 together with a rabbit polyclonal antibody to peroxisomal membrane protein 70 (PMP70), followed by Cy3-conjugated anti-mouse IgG and Alexa-488–conjugated anti-rabbit IgG. (A–F) Representative fluorescence microscopy images of anti-Tyrp1 staining, which were acquired and processed under identical conditions. Bar, 25 μm. (G) The relative amounts of anti-Tyrp1 and anti-PMP70 staining were estimated as the average fluorescence intensity per cell of 22–59 randomly selected melanocytes per independent culture for each strain and normalized to the average value obtained for wild-type melanocytes (□) analyzed in parallel. Solid bars represent means ± SD of the indicated number of independent cultures per strain. _#_p < 0.05, different from the reference value of 1 set for wild-type melanocytes (one-sample t test). *p < 0.05, different from AP-3–deficient (pe) melanocytes (ANOVA followed by Dunnett’s test). (H) Cultured wild-type, pearl (pe), and pallid (pa) melanocytes were divided into two aliquots and incubated in medium alone (−) or medium containing 1 mg/ml leupeptin (+) for 6 h before fixation/permeabilization, followed by immunofluorescence staining and image analysis. Data points represent the Tyrp1 staining signal per cell of randomly selected melanocytes in each sample, normalized to the average signal obtained for wild-type melanocytes not treated with leupeptin. Horizontal lines represent mean values. Mann-Whitney test of each group of leupeptin-treated versus untreated melanocytes: ns, not significant; ***p < 0.001.
Figure 8.
Schematic model of how BLOC-1, BLOC-2, and AP-3 may cooperate to facilitate Tyrp1 trafficking from endosomes to melanosomes. See the text for details.
Similar articles
- BLOC-1 is required for cargo-specific sorting from vacuolar early endosomes toward lysosome-related organelles.
Setty SR, Tenza D, Truschel ST, Chou E, Sviderskaya EV, Theos AC, Lamoreux ML, Di Pietro SM, Starcevic M, Bennett DC, Dell'Angelica EC, Raposo G, Marks MS. Setty SR, et al. Mol Biol Cell. 2007 Mar;18(3):768-80. doi: 10.1091/mbc.e06-12-1066. Epub 2006 Dec 20. Mol Biol Cell. 2007. PMID: 17182842 Free PMC article. - BLOC-2, AP-3, and AP-1 proteins function in concert with Rab38 and Rab32 proteins to mediate protein trafficking to lysosome-related organelles.
Bultema JJ, Ambrosio AL, Burek CL, Di Pietro SM. Bultema JJ, et al. J Biol Chem. 2012 Jun 1;287(23):19550-63. doi: 10.1074/jbc.M112.351908. Epub 2012 Apr 16. J Biol Chem. 2012. PMID: 22511774 Free PMC article. - Insights into the biogenesis of lysosome-related organelles from the study of the Hermansky-Pudlak syndrome.
Bonifacino JS. Bonifacino JS. Ann N Y Acad Sci. 2004 Dec;1038:103-14. doi: 10.1196/annals.1315.018. Ann N Y Acad Sci. 2004. PMID: 15838104 - AP-3-dependent trafficking and disease: the first decade.
Dell'Angelica EC. Dell'Angelica EC. Curr Opin Cell Biol. 2009 Aug;21(4):552-9. doi: 10.1016/j.ceb.2009.04.014. Epub 2009 Jun 3. Curr Opin Cell Biol. 2009. PMID: 19497727 Review. - The BLOC interactomes form a network in endosomal transport.
Li W, Feng Y, Hao C, Guo X, Cui Y, He M, He X. Li W, et al. J Genet Genomics. 2007 Aug;34(8):669-82. doi: 10.1016/S1673-8527(07)60076-9. J Genet Genomics. 2007. PMID: 17707211 Review.
Cited by
- BLOC-3 mutated in Hermansky-Pudlak syndrome is a Rab32/38 guanine nucleotide exchange factor.
Gerondopoulos A, Langemeyer L, Liang JR, Linford A, Barr FA. Gerondopoulos A, et al. Curr Biol. 2012 Nov 20;22(22):2135-9. doi: 10.1016/j.cub.2012.09.020. Epub 2012 Oct 18. Curr Biol. 2012. PMID: 23084991 Free PMC article. - SCARB2/LIMP-2 Regulates IFN Production of Plasmacytoid Dendritic Cells by Mediating Endosomal Translocation of TLR9 and Nuclear Translocation of IRF7.
Guo H, Zhang J, Zhang X, Wang Y, Yu H, Yin X, Li J, Du P, Plumas J, Chaperot L, Chen J, Su L, Liu Y, Zhang L. Guo H, et al. J Immunol. 2015 May 15;194(10):4737-49. doi: 10.4049/jimmunol.1402312. Epub 2015 Apr 10. J Immunol. 2015. PMID: 25862818 Free PMC article. - The WASH complex, an endosomal Arp2/3 activator, interacts with the Hermansky-Pudlak syndrome complex BLOC-1 and its cargo phosphatidylinositol-4-kinase type IIα.
Ryder PV, Vistein R, Gokhale A, Seaman MN, Puthenveedu MA, Faundez V. Ryder PV, et al. Mol Biol Cell. 2013 Jul;24(14):2269-84. doi: 10.1091/mbc.E13-02-0088. Epub 2013 May 15. Mol Biol Cell. 2013. PMID: 23676666 Free PMC article. - The N-ethylmaleimide-sensitive factor and dysbindin interact to modulate synaptic plasticity.
Gokhale A, Mullin AP, Zlatic SA, Easley CA 4th, Merritt ME, Raj N, Larimore J, Gordon DE, Peden AA, Sanyal S, Faundez V. Gokhale A, et al. J Neurosci. 2015 May 13;35(19):7643-53. doi: 10.1523/JNEUROSCI.4724-14.2015. J Neurosci. 2015. PMID: 25972187 Free PMC article. - Adaptor protein-3 in dendritic cells facilitates phagosomal toll-like receptor signaling and antigen presentation to CD4(+) T cells.
Mantegazza AR, Guttentag SH, El-Benna J, Sasai M, Iwasaki A, Shen H, Laufer TM, Marks MS. Mantegazza AR, et al. Immunity. 2012 May 25;36(5):782-94. doi: 10.1016/j.immuni.2012.02.018. Epub 2012 May 3. Immunity. 2012. PMID: 22560444 Free PMC article.
References
- Clark R. H., Stinchcombe J. C., Day A., Blott E., Booth S., Bossi G., Hamblin T., Davis E. G., Griffiths G. M. Adaptor protein 3-dependent microtubule-mediated movement of lytic granules to the immunological synapse. Nat. Immunol. 2003;4:1111–1120. - PubMed
- Dell’Angelica E. C., Ooi C. E., Bonifacino J. S. β3a-adaptin, a subunit of the adaptor-like complex AP-3. J. Biol. Chem. 1997b;272:15078–15084. - PubMed
- Dell’Angelica E. C., Klumperman J., Stoorvogel W., Bonifacino J. S. Association of the AP-3 adaptor complex with clathrin. Science. 1998;280:431–434. - PubMed
- Dell’Angelica E. C., Mullins C., Bonifacino J. S. AP-4, a novel protein complex related to clathrin adaptors. J. Biol. Chem. 1999a;274:7278–7285. - PubMed
Publication types
MeSH terms
Substances
Grants and funding
- R01 HL068117/HL/NHLBI NIH HHS/United States
- R01 EY015625-03/EY/NEI NIH HHS/United States
- EY015625/EY/NEI NIH HHS/United States
- AI28697/AI/NIAID NIH HHS/United States
- CA16042/CA/NCI NIH HHS/United States
- R01 EY015625/EY/NEI NIH HHS/United States
- P30 CA016042/CA/NCI NIH HHS/United States
- P30 AI028697/AI/NIAID NIH HHS/United States
- HL068117/HL/NHLBI NIH HHS/United States
- R01 EY015143/EY/NEI NIH HHS/United States
- EY015143/EY/NEI NIH HHS/United States
LinkOut - more resources
Full Text Sources
Other Literature Sources
Molecular Biology Databases
Research Materials
Miscellaneous

