Signaling from blood vessels to CNS axons through nitric oxide - PubMed (original) (raw)
Signaling from blood vessels to CNS axons through nitric oxide
Giti Garthwaite et al. J Neurosci. 2006.
Erratum in
- J Neurosci. 2006 Aug 9;26(32):1 p preceding 8217. Kollb-Sielecka, Martha [corrected to Kollb-Sielecka, Marta]
Abstract
Brain function is usually perceived as being performed by neurons with the support of glial cells, the network of blood vessels situated nearby serving simply to provide nutrient and to dispose of metabolic waste. Revising this view, we find from experiments on a rodent central white matter tract (the optic nerve) in vitro that microvascular endothelial cells signal persistently to axons using nitric oxide (NO) derived from the endothelial NO synthase (eNOS). The endogenous NO acts to stimulate guanylyl cyclase-coupled NO receptors in the axons, leading to a raised cGMP level which then causes membrane depolarization, apparently by directly engaging hyperpolarization-activated cyclic nucleotide-gated ion channels. The tonic depolarization and associated endogenous NO-dependent cGMP generation was absent in optic nerves from mice lacking eNOS, although such nerves responded to exogenous NO, with raised cGMP generation in the axons and associated depolarization. In addition to the tonic activity, exposure of optic nerves to bradykinin, a classical stimulator of eNOS in endothelial cells, elicited reversible NO- and cGMP-dependent depolarization through activation of bradykinin B2 receptors, to which eNOS is physically complexed. No contribution of other NO synthase isoforms to either the action of bradykinin or the continuous ambient NO level could be detected. The results suggest that microvascular endothelial cells participate in signal processing in the brain and can do so by generating both tonic and phasic NO signals.
Figures
Figure 1.
Depolarizing action of exogenous and endogenous NO on rat optic nerve. a, Concentration–response curve for PAPA/NO-induced depolarization (filled circles; n = 3–20). Inhibition of the responses to 1 and 10 μ
m
PAPA/NO by 3 μ
m
ODQ are also illustrated (filled squares; n = 3–4). Insets are typical responses to 1 and 3 μ
m
PAPA/NO applied for the duration shown by the bars. b, Hyperpolarizing effect of
l
-nitroarginine (L-NNA). c, Depolarizing effect of
l
-arginine (L-Arg). d, Inhibition of
l
-arginine-induced depolarization by
l
-nitroarginine. e, Repeatable hyperpolarizations on perfusion of
l
-methylarginine (L-MeArg). f,
l
-Arginine overcomes hyperpolarization by
l
-methylarginine. g,
d
-Arginine fails to affect
l
-methylarginine-induced hyperpolarization. h, Summary data for experiments illustrated in b–g and, for ODQ, in Figure 3_b_ (n = 3–9; ∗p < 0.03 and ∗∗p < 0.0002 vs the baseline; +p < 0.02 vs
l
-methylarginine control). Calibration bars are all as in g.
Figure 2.
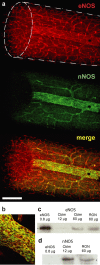
NO synthase isoform expression in rat optic nerve. a, Confocal microscopic images of eNOS (red) and nNOS (green) staining in whole-mount preparation, with the merged image shown underneath. The shape of the specimen is indicated with broken lines in the top image, the ellipse being the cut end; this shows that eNOS, but not nNOS, is located within the nerve. b, Merged image of eNOS (red) and nNOS (green) showing colocation in endothelial cells. The images (a, b) are representative of 12 nerves examined. c, d, Immunoblots for eNOS (c) and nNOS (d) in extracts of rat cerebellum (Cblm) and optic nerve (RON); the eNOS control (left lanes) was from lysates of Sf21 cells expressing recombinant human eNOS. Arrowheads in c and d correspond to molecular weights of 133 and 161 kDa, respectively. The blots are representative of five performed. Scale bar (in a): a, 200 μm; b, 70 μm.
Figure 3.
Role of cGMP in depolarizing effect of NO in rat optic nerve. a, Block of PAPA/NO-induced depolarization by ODQ. Summary data for this experiment are given in Figure 1_a_. b, ODQ produces a hyperpolarization and inhibits the hyperpolarizing action of
l
-nitroarginine (L-NNA; summary data for this experiment are given in Fig. 1_h_). c, Concentration-dependent depolarization by 8-Br-cAMP (squares; n = 3–4) and 8-Br-cGMP (circles; n = 3–5). d, e, Depolarizations by BAY 41-2272 (BAY) and YC-1 and their inhibition by
l
-nitroarginine (L-NNA). Calibration in d applies to all traces. f, Summary data for experiments shown in d and e (n = 3–6; ∗p < 0.02, ∗∗p < 0.01, †p < 0.03 by two-tailed t test compared with controls). g, Concentration–cGMP response curve for PAPA/NO in the absence (filled circles; n = 5–10) and presence (open circles; n = 3–5) of ODQ. h,
l
-Arginine, BAY 41-2272, and YC-1 enhance cGMP levels in the presence of the phosphodiesterase inhibitor IBMX and the inhibition by
l
-nitroarginine and ODQ (n = 3–6; ∗p < 0.05, ∗∗p < 0.01 vs IBMX control, Dunnett’s test; †p < 0.001 vs BAY 41-2272 or YC-1 controls, t test).
Figure 4.
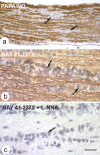
Immunostaining for cGMP in rat optic nerve. a, The nerve was exposed to 30 μ
m
PAPA/NO (5 min) before being fixed and processed for cGMP immunocytochemistry, resulting in selective staining of axons (brown); glial cells were unstained. The image is representative of four nerves examined in this way (resin sections). b, c, cGMP immunocytochemistry on frozen sections of nerves exposed to BAY 41-2272 (1 μ
m
) in the absence (b) and presence (c) of 100 μ
m l
-nitroarginine (L-NNA) (n = 3 for each condition). Examples of rows of glial cells are indicated in a–c by arrows. Scale bar (in c): a, 81 μm; b, c, 13 μm.
Figure 5.
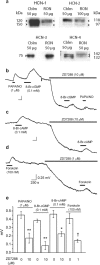
Role of HCN channels in NO-induced depolarization of rat optic nerve. a, Immunoblot for HCN channels (isoforms 1–4) in rat optic nerve (RON) compared with rat cerebellum (Cblm). Except for HCN-3, the blots show doublets of the indicated molecular weights, signifying glycosylated and nonglycosylated channel protein. Results are representative of two to three separate tissue preparations. b–d, ZD7288 causes a hyperpolarization and inhibits the depolarizing effect of PAPA/NO and 8-Br-cGMP (b), 8-Br-cAMP (c), and forskolin (d). Calibration in d applies to all traces. e, Summary data for the above experiments (n = 3–7; ∗p = 0.004, ∗∗p = 0.002, †p < 0.01 vs respective controls).
Figure 6.
Loss of tonic NO and of the associated depolarization in optic nerves from eNOS knock-out (eNOS−/−) mice. a–d, Confocal images of whole-mount preparations from WT (a, b) and eNOS knock-out (c, d) mice immunostained for eNOS (a, b) and nNOS (b, d). e–h, Optic nerves from wild-type (e, f) and eNOS knock-out (g, h) mice incubated for 5 min with 30 μ
m
PAPA/NO (e, g) or BAY 41–2272 (f, h; 1 and 3 μ
m,
respectively). Frozen sections were costained for neurofilament-200 (red), cGMP (green), and the nuclear stain DAPI (blue), and the images were merged. a–h are representative of three to five nerves examined in each condition. Scale bar (in d): a–d, 100 μm; e–h, 25 μm. i, k, Hyperpolarization by
l
-nitroarginine (L-NNA) in wild-type mouse optic nerves (i) and lack thereof in eNOS knock-outs (k). j, l, Depolarization by PAPA/NO and its inhibition by ZD7288 in wild-type (j) and eNOS knock-out (l) mouse optic nerve. Calibration in l applies to all traces. m, Summary data for the above experiments (i–l; n = 3–7; ∗p = 0.03 vs controls; +p = 0.001 vs baseline). n, Quantitation of cGMP immunostaining in wild-type and eNOS knock-out nerves in response to PAPA/NO (30 μ
m
) and BAY 41-2272 (BAY; 1 μ
m
in WT, 3 μ
m
in eNOS knock-outs). ∗p = 0.0003 versus wild-type response (n = 3).
Figure 7.
Effect of bradykinin and the roles of nNOS and iNOS in rat optic nerve. a–d, Inhibition of bradykinin (BK)-induced depolarization by
l
-nitroarginine (L-NNA), ODQ, HOE-140, and ZD7288. e, Summary data for experiments shown in a–d (n = 3–4; ∗p < 0.009, ∗∗p < 0.002, +p < 0.001, ++p < 0.00001 by two-tailed t test vs bradykinin controls). f, Bradykinin elevated cGMP, and this response was inhibited by
l
-nitroarginine, ODQ, and HOE-140 at the concentrations used in a–e (n = 4–5; ∗p < 0.01 compared with bradykinin control, +p < 0.01 compared with basal level by Dunnett’s test). All data were obtained in the presence of IBMX (1 m
m
). g, Representative trace showing that the nNOS inhibitor NPA did not cause a hyperpolarization (unlike
l
-nitroarginine) and did not affect the bradykinin-induced depolarization. h, Summary data for the effects of nNOS/iNOS inhibitors. None induced a significant hyperpolarization or affected the bradykinin-induced depolarization significantly, whereas
l
-nitroarginine retained its hyperpolarizing effect in their presence (n = 3–5; ∗p < 0.001 vs baseline).
Similar articles
- Presynaptic nitric oxide/cGMP facilitates glutamate release via hyperpolarization-activated cyclic nucleotide-gated channels in the hippocampus.
Neitz A, Mergia E, Eysel UT, Koesling D, Mittmann T. Neitz A, et al. Eur J Neurosci. 2011 May;33(9):1611-21. doi: 10.1111/j.1460-9568.2011.07654.x. Epub 2011 Mar 17. Eur J Neurosci. 2011. PMID: 21410795 - Hyperpolarization-activated ion channels as targets for nitric oxide signalling in deep cerebellar nuclei.
Wilson GW, Garthwaite J. Wilson GW, et al. Eur J Neurosci. 2010 Jun;31(11):1935-45. doi: 10.1111/j.1460-9568.2010.07226.x. Epub 2010 Jun 1. Eur J Neurosci. 2010. PMID: 20529121 Free PMC article. - A cell-based nitric oxide reporter assay useful for the identification and characterization of modulators of the nitric oxide/guanosine 3',5'-cyclic monophosphate pathway.
Wunder F, Buehler G, Hüser J, Mundt S, Bechem M, Kalthof B. Wunder F, et al. Anal Biochem. 2007 Apr 15;363(2):219-27. doi: 10.1016/j.ab.2007.02.001. Epub 2007 Feb 4. Anal Biochem. 2007. PMID: 17336915 - Traumatic injury of the spinal cord and nitric oxide.
Marsala J, Orendácová J, Lukácová N, Vanický I. Marsala J, et al. Prog Brain Res. 2007;161:171-83. doi: 10.1016/S0079-6123(06)61011-X. Prog Brain Res. 2007. PMID: 17618976 Review. - Neuronal and endothelial nitric oxide synthase gene knockout mice.
Huang PL. Huang PL. Braz J Med Biol Res. 1999 Nov;32(11):1353-9. doi: 10.1590/s0100-879x1999001100005. Braz J Med Biol Res. 1999. PMID: 10559836 Review.
Cited by
- Spatial and temporal patterns of nitric oxide diffusion and degradation drive emergent cerebrovascular dynamics.
Haselden WD, Kedarasetti RT, Drew PJ. Haselden WD, et al. PLoS Comput Biol. 2020 Jul 27;16(7):e1008069. doi: 10.1371/journal.pcbi.1008069. eCollection 2020 Jul. PLoS Comput Biol. 2020. PMID: 32716940 Free PMC article. - Pinacidil induces vascular dilation and hyperemia in vivo and does not impact biophysical properties of neurons and astrocytes in vitro.
Cao R, Higashikubo BT, Cardin J, Knoblich U, Ramos R, Nelson MT, Moore CI, Brumberg JC. Cao R, et al. Cleve Clin J Med. 2009 Apr;76 Suppl 2(0 2):S80-5. doi: 10.3949/ccjm.76.s2.16. Cleve Clin J Med. 2009. PMID: 19380306 Free PMC article. - The multiple actions of NO.
Gao Y. Gao Y. Pflugers Arch. 2010 May;459(6):829-39. doi: 10.1007/s00424-009-0773-9. Epub 2009 Dec 19. Pflugers Arch. 2010. PMID: 20024580 Review. - Mechanisms of activity-dependent plasticity in cellular nitric oxide-cGMP signaling.
Halvey EJ, Vernon J, Roy B, Garthwaite J. Halvey EJ, et al. J Biol Chem. 2009 Sep 18;284(38):25630-41. doi: 10.1074/jbc.M109.030338. Epub 2009 Jul 15. J Biol Chem. 2009. PMID: 19605352 Free PMC article. - Deficiency of Endothelial Nitric Oxide Synthase (eNOS) Exacerbates Brain Damage and Cognitive Deficit in A Mouse Model of Vascular Dementia.
An L, Shen Y, Chopp M, Zacharek A, Venkat P, Chen Z, Li W, Qian Y, Landschoot-Ward J, Chen J. An L, et al. Aging Dis. 2021 Jun 1;12(3):732-746. doi: 10.14336/AD.2020.0523. eCollection 2021 Jun. Aging Dis. 2021. PMID: 34094639 Free PMC article.
References
- Abudara V, Alvarez AF, Chase MH, Morales FR (2002). Nitric oxide as an anterograde neurotransmitter in the trigeminal motor pool. J Neurophysiol 88:497–506. - PubMed
- Awatramani GB, Price GD, Trussell LO (2005). Modulation of transmitter release by presynaptic resting potential and background calcium levels. Neuron 48:109–121. - PubMed
- Blackshaw S, Eliasson MJ, Sawa A, Watkins CC, Krug D, Gupta A, Arai T, Ferrante RJ, Snyder SH (2003). Species, strain and developmental variations in hippocampal neuronal and endothelial nitric oxide synthase clarify discrepancies in nitric oxide-dependent synaptic plasticity. Neuroscience 119:979–990. - PubMed
- Carmeliet P, Tessier-Lavigne M (2005). Common mechanisms of nerve and blood vessel wiring. Nature 436:193–200. - PubMed
Publication types
MeSH terms
Substances
LinkOut - more resources
Full Text Sources
Other Literature Sources
Molecular Biology Databases


