Stat1 and SUMO modification - PubMed (original) (raw)
Stat1 and SUMO modification
Li Song et al. Blood. 2006.
Abstract
Many proteins are known to undergo small ubiquitin-related modifier (SUMO) modification by an E1-, E2-, and E3-dependent ligation process. Recognition that protein inhibitor of activated signal transducers and activators of transcription (STATs) (PIAS) proteins are SUMO E3 ligases raised the possibility that STATs may also be regulated by SUMO modification. Consistent with this possibility, a SUMO-ylation consensus site (PsiKxE; Psi indicates hydrophobic residue, and x indicates any residue) was identified in Stat1 (ie, (702)IKTE(705)), but not in other STATs. Biochemical analysis confirmed that Stat1 K(703) could be SUMO modified in vitro. Mutation of this critical lysine (ie, Stat1(K703R)) yielded a protein that, when expressed in Stat1(-/-) mouse embryonic fibroblasts (MEFs), exhibited enhanced DNA binding and nuclear retention. This was associated with modest changes in transcriptional and antiviral activity. However, mutation of the second critical residue in the SUMO consensus site, E(705) (ie, Stat1(E705A)), yielded a protein with wild-type DNA binding, nuclear retention, and transcriptional and antiviral activity. Similar observations were made when these mutants were expressed in primary Stat1(-/-) macrophages. These observations suggest that although Stat1 can uniquely be SUMO-ylated in vitro, this modification is unlikely to play an important role in regulating Stat1 activity in vivo.
Figures
Figure 1.
Stat1 SUMO-ylation in HEK-293T cells. (A) HEK-293T cells were transfected with HA–SUMO-1, Ubc9, and/or PIASy. Later (48 hours), they were stimulated with IFN-γ (3 ng/mL for 30 minutes). WCEs were immunoprecipitated with an anti-Stat1 antibody and sequentially immunoblotted with HA and Stat1 antibodies. (B) Left panel: 48 hours after transfection with HA–SUMO-1 and Ubc9, HEK-293T cells were stimulated with IFN-γ (3 ng/mL for 30 minutes). WCEs were either precipitated with a biotinylated GAS oligonucleotide (Oligo; Table S1) or Stat1-specific antibody (α-Stat1). Precipitates were fractionated by SDS-PAGE, and sequentially immunoblotted with Stat1-phosphotyrosine (top) and Stat1-specific antibodies (bottom). Right panel: WCEs were prepared 48 hours after transfection with His–SUMO-1 and Ubc9; HEK-293T cells were stimulated with IFN-γ (3 ng/mL for 30 minutes) and either precipitated with a Stat1-specific antibody (anti-Stat1) or ProBond nickel beads, and sequentially immunoblotted with Stat1-phosphotyrosine (top) and Stat1-specific antibodies (bottom). Nonspecific (NS) band is indicated. Data are representative of 3 independent studies.
Figure 2.
In vitro SUMO conjugation assay. (A) Purified recombinant Stat1 (0.5 μM) is SUMO-ylated in vitro after incubation with SUMO-1 (2 μM), E1 (Uba2/Aos1; 0.3 μM), E2 (Ubc9; 0.3 μM), and E3 (PIAS1 or Nup358 at 0.3 μM) for 1 hour at 37°C. Samples were fractionated by SDS-PAGE and immunoblotted with anti-Stat1. Mobility of molecular weight markers and Stat1 isoforms are indicated. (B) Wild-type and mutant p53, Stat1, PO4-Stat1, and Stat3 peptides (500 μM) were SUMO-ylated, as in panel A, in the absence of E3, with either wild-type or mutant Ubc9 for 5 or 24 hours at 37°C. Samples were fractionated by SDS-PAGE and stained with Coomassie Blue. (C) Graphic representation of a more detailed kinetic SUMO-ylation assay of peptides from panel B (t = 0, 10, 40, 60, 90, 160, and 300 minutes). Maximal conjugation is 1.0. Products were detected by staining the gel with Sypro (Bio-Rad). The images were quantified on Quantity One Software (Bio-Rad). Error bars indicate standard deviation.
Figure 3.
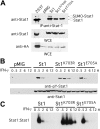
IFN-γ–dependent Stat1, Stat1K703R, and Stat1E705A activation. (A) Stat1–/– MEFs, infected with an empty vector (pMIG) or retroviral vectors directing expression of either Stat1 (St1), Stat1k703R (St1K703R), or Stat1E705A (St1E705A), were subsequently transfected with HA–SUMO-1 and Ubc9 cDNA constructs. WCEs were prepared, immunoprecipitated with anti-Stat1, fractionated on 7% SDS-PAGE, and immunoblotted for Stat1 (top panel); or extracts were directly fractionated on 12% SDS-PAGE and sequentially immunoblotted with anti-Stat1 and anti-HA (bottom panels). WCEs from 293T cells transfected with HA–SUMO-1 and Ubc9 from Figure 1 served as positive controls. (B) Stat1_–/_– MEFs from panel A were stimulated with IFN-γ (50 U/mL for 0.5-12 hours). WCEs were prepared, fractionated by SDS-PAGE, and sequentially immunoblotted with antibodies specific for phosphotyrosine-Stat1 (top panel) and total Stat1 (bottom panel). (C) Extracts from panel B were evaluated by EMSA with a GAS probe. Data are representative of 3 independent studies in MEFs.
Figure 4.
Kinetics of IFN-γ–dependent Stat1 and Stat1K703R DNA binding. (A) Stat1_–/_– MEFs, infected with retroviral vectors directing expression of either Stat1 (St1) or Stat1K703R (St1K703R), were stimulated with IFN-γ (66 U/mL for 30 minutes). Dissociation kinetics of Stat1 DNA binding activity were determined by incubating the IFN-γ–stimulated extracts with a labeled GAS probe (0.1 pmol for 20 minutes at 22°C) and then chasing with a 100-fold excess of cold probe. Aliquots were removed at indicated times and loaded onto a running gel. (B) Quantification of DNA binding from panel A was determined by ImageQuant (BD Molecular Dynamics, Santa Clara, CA) and plotted as fraction bound versus time. (C) Relative affinity was determined by simultaneously incubating IFN-γ–stimulated WCEs (from panel A) with a labeled GAS probe (0.1 pmol) and increasing molar excess of cold probe, as indicated (20 minutes at 22°C). Samples were then run on EMSA gel. (D) Quantification of DNA binding results from panel C was determined by imagequant and plotted as fraction bound versus molar excess of cold probe. Data are representative of 3 independent studies. Error bars indicate standard deviation.
Figure 5.
IFN-γ–dependent nuclear localization of Stat1, Stat1K703R, and Stat1E705A. Stat1–/– MEFs expressing physiologic levels of either Stat1 (St1), Stat1K703R (St1K703R), or Stat1E705A (St1E705A), as in Figure 3, were stimulated with IFN-γ (50 U/mL for 0, 0.5, and 6 hours). Cells were fixed and either imaged for the expression of a GFP reporter gene or after immunostaining with anti-Stat1. Cells were examined under a 40 × Nikon epifluorescence objective. Pictures were taken using a Nikon Plan Fluor ELWD 40×/0.60 objective lens and a SPOT RT color camera with SPOT advanced software (Diagnostic Instruments, Sterling Heights, MI). Data are representative of more than 3 independent studies.
Figure 6.
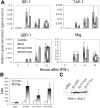
IFN-γ–dependent expression of target genes in Stat1, Stat1K703R, and Stat1E705A MEFs. (A) Total RNA was prepared from Stat1_–/_– MEFs ectopically expressing empty vector (pMIG), Stat1 (St1), Stat1K703R (St1K703R), or Stat1E705A (St1E705A), as in Figure 4, after stimulation with IFN-γ (50 U/mL for 0-12 hours), as indicated. The expression of target genes (IRF1, TAP1, GBP1, and Mig) was determined by quantitative PCR (Q-PCR) from cDNA templates. The relative expression of each gene was normalized to β-actin expression. (B) Stat1_–/_– MEFs, ectopically expressing empty vector (pMIG), Stat1 (St1), Stat1K703R (St1K703R), or Stat1E705A (St1E705A), were transiently transfected with a GAS-driven luciferase reporter (B2SH-WT3-Luc) in triplicate and stimulated with IFN-γ (50 U/mL for 6 hours). Samples were harvested and evaluated for luciferase and renilla activity (in arbitrary light units). Data are representative of 2 independent experiments. Error bars indicate standard deviation. (C) Immunoblot demonstrates that Stat1 expression (wild-type and mutants) was similar in all 3 Stat1-expressing lines.
Figure 7.
Biologic response of Stat1, Stat1K703R, and Stat1E705A in MEFs and macrophages. (A) IFN-γ–dependent antiviral response of Stat1, Stat1K703R, and Stat1E705A MEFs. Top panel: Stat1_–/_– MEFs ectopically expressing empty vector (pMIG), Stat1 (St1), Stat1K703R (St1K703R), or Stat1E705A (St1E705A), as in Figure 4, were infected with VSV (MOI = 0.5) after IFN-γ (0, 0.5, 5, and 50 U/mL for 16 hours) pretreatment. Viral yield in supernatants of infected cells was determined, in triplicate, by plaque assay on Vero cells. Data are presented as total recovered PFUs (plaque-forming units). Bottom panel: viral yield from pMIG, St1, St1K703R, and St1E705A MEFs infected in triplicate with VSV at varying MOIs (0.001, 0.01, 0.1, and 1) after IFN-γ (5 U/mL for 16 hours) pretreatment. Viral titer was determined as for the top panel and is representative of 3 independent studies. (B) IFN-γ–dependent Stat1, Stat1K703R, and Stat1E705A activity in macrophages. Top panel: Stat1_–/_– macrophages, infected with empty vector (pMIG), Stat1 (St1), Stat1K703R (St1K703R), or Stat1E705A (St1E705A), were evaluated for their capacity to produce NO 72 hours after stimulation with IFN-γ (50 U/mL) and/or LPS (2 μg/mL). Bottom left panel: surface MHC-II expression in GFP+ BMMs was determined by FACS 48 hours after stimulation with IFN-γ (50 U/mL). Bottom right panel: immunoblot demonstrates that Stat1 expression was similar in each set of transfectants. Data are representative of 3 independent studies. Error bars indicate standard deviation.
Similar articles
- SUMO modification of STAT1 and its role in PIAS-mediated inhibition of gene activation.
Rogers RS, Horvath CM, Matunis MJ. Rogers RS, et al. J Biol Chem. 2003 Aug 8;278(32):30091-7. doi: 10.1074/jbc.M301344200. Epub 2003 May 22. J Biol Chem. 2003. PMID: 12764129 - PIAS proteins promote SUMO-1 conjugation to STAT1.
Ungureanu D, Vanhatupa S, Kotaja N, Yang J, Aittomaki S, Jänne OA, Palvimo JJ, Silvennoinen O. Ungureanu D, et al. Blood. 2003 Nov 1;102(9):3311-3. doi: 10.1182/blood-2002-12-3816. Epub 2003 Jul 10. Blood. 2003. PMID: 12855578 - Protein inhibitor of activated STAT Y (PIASy) and a splice variant lacking exon 6 enhance sumoylation but are not essential for embryogenesis and adult life.
Wong KA, Kim R, Christofk H, Gao J, Lawson G, Wu H. Wong KA, et al. Mol Cell Biol. 2004 Jun;24(12):5577-86. doi: 10.1128/MCB.24.12.5577-5586.2004. Mol Cell Biol. 2004. PMID: 15169916 Free PMC article. - PIAS proteins: pleiotropic interactors associated with SUMO.
Rytinki MM, Kaikkonen S, Pehkonen P, Jääskeläinen T, Palvimo JJ. Rytinki MM, et al. Cell Mol Life Sci. 2009 Sep;66(18):3029-41. doi: 10.1007/s00018-009-0061-z. Epub 2009 Jun 13. Cell Mol Life Sci. 2009. PMID: 19526197 Free PMC article. Review. - PIAS proteins as regulators of small ubiquitin-related modifier (SUMO) modifications and transcription.
Palvimo JJ. Palvimo JJ. Biochem Soc Trans. 2007 Dec;35(Pt 6):1405-8. doi: 10.1042/BST0351405. Biochem Soc Trans. 2007. PMID: 18031232 Review.
Cited by
- RanBP2/Nup358 Mediates Sumoylation of STAT1 and Antagonizes Interferon-α-Mediated Antiviral Innate Immunity.
Li J, Su L, Jiang J, Wang YE, Ling Y, Qiu Y, Yu H, Huang Y, Wu J, Jiang S, Zhang T, Palazzo AF, Shen Q. Li J, et al. Int J Mol Sci. 2023 Dec 25;25(1):299. doi: 10.3390/ijms25010299. Int J Mol Sci. 2023. PMID: 38203469 Free PMC article. - Roles of Nucleoporin RanBP2/Nup358 in Acute Necrotizing Encephalopathy Type 1 (ANE1) and Viral Infection.
Jiang J, Wang YE, Palazzo AF, Shen Q. Jiang J, et al. Int J Mol Sci. 2022 Mar 24;23(7):3548. doi: 10.3390/ijms23073548. Int J Mol Sci. 2022. PMID: 35408907 Free PMC article. Review. - Crosstalk between nucleocytoplasmic trafficking and the innate immune response to viral infection.
Shen Q, Wang YE, Palazzo AF. Shen Q, et al. J Biol Chem. 2021 Jul;297(1):100856. doi: 10.1016/j.jbc.2021.100856. Epub 2021 Jun 29. J Biol Chem. 2021. PMID: 34097873 Free PMC article. Review. - Differential Regulation of Type I and Type III Interferon Signaling.
Stanifer ML, Pervolaraki K, Boulant S. Stanifer ML, et al. Int J Mol Sci. 2019 Mar 21;20(6):1445. doi: 10.3390/ijms20061445. Int J Mol Sci. 2019. PMID: 30901970 Free PMC article. Review. - Differential induction of interferon stimulated genes between type I and type III interferons is independent of interferon receptor abundance.
Pervolaraki K, Rastgou Talemi S, Albrecht D, Bormann F, Bamford C, Mendoza JL, Garcia KC, McLauchlan J, Höfer T, Stanifer ML, Boulant S. Pervolaraki K, et al. PLoS Pathog. 2018 Nov 28;14(11):e1007420. doi: 10.1371/journal.ppat.1007420. eCollection 2018 Nov. PLoS Pathog. 2018. PMID: 30485383 Free PMC article.
References
- Schindler C, Shuai K, Prezioso V, Darnell JE. Interferon-dependent tyrosine phosphorylation of a latent cytoplasmic transcription factor. Science. 1992;257: 809-813. - PubMed
- Shuai K, Schindler C, Prezioso V, Darnell JE. Activation of transcription by IFN-γ: tyrosine phosphorylation of a 91-kDa DNA binding protein. Science. 1992;258: 1808-1812. - PubMed
- Levy DE, Darnell JE Jr. Stats: transcriptional control and biological impact. Nat Rev Mol Cell Biol. 2002;3: 651-662. - PubMed
- Kisseleva T, Bhattacharya S, Braunstein J, Schindler CW. Signaling through the JAK/STAT pathway, recent advances and future challenges. Gene. 2002; 285: 1-24. - PubMed
Publication types
MeSH terms
Substances
LinkOut - more resources
Full Text Sources
Other Literature Sources
Molecular Biology Databases
Research Materials
Miscellaneous


