Transcriptional repression and DNA hypermethylation of a small set of ES cell marker genes in male germline stem cells - PubMed (original) (raw)
Transcriptional repression and DNA hypermethylation of a small set of ES cell marker genes in male germline stem cells
Masanori Imamura et al. BMC Dev Biol. 2006.
Abstract
Background: We previously identified a set of genes called ECATs (ES cell-associated transcripts) that are expressed at high levels in mouse ES cells. Here, we examine the expression and DNA methylation of ECATs in somatic cells and germ cells.
Results: In all ECATs examined, the promoter region had low methylation levels in ES cells, but higher levels in somatic cells. In contrast, in spite of their lack of pluripotency, male germline stem (GS) cells expressed most ECATs and exhibited hypomethylation of ECAT promoter regions. We observed a similar hypomethylation of ECAT loci in adult testis and isolated sperm. Some ECATs were even less methylated in male germ cells than in ES cells. However, a few ECATs were not expressed in GS cells, and most of them targets of Oct3/4 and Sox2. The Octamer/Sox regulatory elements were hypermethylated in these genes. In addition, we found that GS cells express little Sox2 protein and low Oct3/4 protein despite abundant expression of their transcripts.
Conclusion: Our results suggest that DNA hypermethylation and transcriptional repression of a small set of ECATs, together with post-transcriptional repression of Oct3/4 and Sox2, contribute to the loss of pluripotency in male germ cells.
Figures
Figure 1
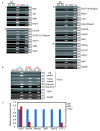
Expression of ECATs in male germline stem (GS)cells and ES cells. A. RT-PCR was performed for the number of cycles shown on the right. We categorized ECATs into four groups based on their relative expression levels in GS cells compared to ES cells. To monitor amplification from genomic DNA, we amplified samples in which reverse transcriptase was omitted from the reverse transcription reaction (RT-). As negative controls, water was added instead of cDNA (H2O). NAT1 and Gapdh were used as loading controls. B. Expression of Fbx15 variants examined by RT-PCR. Our previous study using 5' RACE showed that Fbx15 is transcribed from different promoters in ES cells and testes in the mouse (unpublished data). The ES cell-specific variant was not detected in GS cells or adult testis, while the testis-specific variant was weakly detected in ES cells. The two transcripts differ only in exon 1 sequence. The common sequence of the two transcripts was also amplified. NAT1 and Gapdh were used as loading controls.C. Real-time PCR quantification of the expression of Oct3/4 and Sox2 target genes. The expression of each gene was normalized with that of Gapdh. The expression in ES cells was set as 1.0.
Figure 2
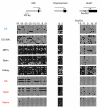
DNA methylation states of ECATs expressed in GS cells. Bisulfite genomic sequencing was performed to examine the DNA methylation profiles for the individual CpG sites of ECAT genes in ES cells, somatic cells, and male germ cells. Schematic diagrams of regions analyzed are shown in the upper part of the figure. Black rectangles represent the exons, and arrows indicate transcription initiation sites. Black horizontal bars indicate the regions analyzed. All of diagrams are in scale relative to a 100-bp scale bar. In the diagram for the Rex1 gene, the shaded square and open circle indicate the binding sites for Rox1 and Oct3/4, respectively. DNA methylation states in ES cells, somatic cells, and germ cells are shown in the lower part of the figure. Open circles indicate unmethylated CpGs and closed circles indicate methylated CpGs. The numbers indicate the relative positions of CpG sites from the transcription initiation site. The CpG nearest to the transcription initiation site is described as -1 (upstream) or 1 (downstream). Positions where CpG is absent due to DNA polymorphism are indicated by hyphens. ES, undifferentiated ES cells (129 background); ES (RA), ES cells differentiated by retinoic acid treatment; MEFs, MEFs derived from E13.5 C57BL/6J embryos; GS, GS cells derived from DBA neonate testis. Brain, kidney, and testis were obtained from 8-week-old C57BL/6J mice. Sperm was isolated from the epididymis of 11-week-old C57BL/6J mice.
Figure 3
DNA methylation states of non-ECAT genes. Bisulfite genomic sequencing was performed to examine the DNA methylation profiles for individual CpG sites in the promoter regions of germ cell specific genes Mvh and preproacrosin, and a differentiation marker Hoxb1 in ES cells, somatic cells, and male germ cells. Results are shown as described in Figure 2. In the diagram for the Hoxb1 gene, the open square and shaded circle indicate the binding sites for Sox2 and Oct1, respectively.
Figure 4
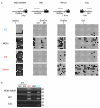
DNA methylation state of the Nanog locus. Bisulfite genomic sequencing was performed to examine the DNA methylation profile of individual CpG sites in the regions flanking exon 1 of Nanog in ES cells, somatic cells, and male and female germ cells. Results are shown as described in Figure 2 and 3 except for the size of the scale bar (500 bp). Oblique lines indicate regions not examined and their approximate lengths are shown. Oocytes were collected from oviducts of C57BL6 mice after superovulation. ND; not determined.
Figure 5
DNA methylation states of Fbx15 and Fgf4 . Bisulfite genomic sequencing was performed to examine the DNA methylation profiles for individual CpG sites in the Fbx15 and Fgf4 loci in ES cells, somatic cells, and male germ cells. Results are shown as described in Figure 2 and 3. Oblique lines indicate regions not examined and their approximate lengths are shown. White rectangle in the diagram for Fgf4 gene indicates 3' UTR.
Figure 6
DNA methylation states of Oct3/4, Sox2, and Utf1 . Bisulfite genomic sequencing was performed to examine the DNA methylation profiles for individual CpG sites in the Oct3/4, Sox2, and Utf1 loci in ES cells, somatic cells, and male germ cells. Results are shown as described in Figure 2 and 3. Oblique lines indicate regions not examined and their approximate lengths are shown.
Figure 7
DNA methylation states of the Octamer/Sox elements of non-ECAT genes. A. Bisulfite genomic sequencing was performed to examine the DNA methylation profiles for individual CpG sites in the Octamer/Sox elements of non-ECAT genes in ES cells, somatic cells, and male germ cells. Results are shown as described in Figure 2 and 3. Oblique lines indicate regions not examined and their approximate lengths are shown. B. Results of RT-PCR showing the expression of REST/NRSF, Rif1, and Tcf3 in ES cells and GS cells.
Figure 8
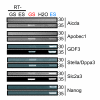
Expression of genes located in the ECAT cluster on chromosome 6. RT-PCR was performed to examine the expression of Aicda, Apobec1, Gdf3, Stella, Slc2a3, and Nanog. PCR amplification cycle numbers are shown on the right.
Figure 9
DNA methylation states of genes in the ECAT cluster on chromosome 6. Bisulfite genomic sequencing was performed to examine the DNA methylation profile of individual CpG sites in the promoter regions of Aicda, Apobec1, Gdf3, Stella/Dppa3, LOC384480, LOC626074, Nanog, and Slc2a3. Results are shown as described in Figure 2 and 3.
Figure 10
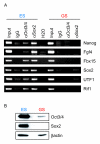
The binding of Oct3/4 and Sox2 to the Octamer/Sox elements. A. ChIP analyses was performed with anti-Oct3/4 antibody (αOct3/4) and anti-Sox2 antiserum (αSox2), or with normal mouse IgG as a negative control (IgG). The genomic region with the Octamer/Sox element in Nanog, Fgf4, Fbx15, Sox2, UTF1, and Rif1 gene was amplified with specific primers. B. Western blot analysis of Oct3/4 and Sox2 proteins in ES cells and GS cells. We used β-actin as a loading control.
Similar articles
- Pluripotency governed by Sox2 via regulation of Oct3/4 expression in mouse embryonic stem cells.
Masui S, Nakatake Y, Toyooka Y, Shimosato D, Yagi R, Takahashi K, Okochi H, Okuda A, Matoba R, Sharov AA, Ko MS, Niwa H. Masui S, et al. Nat Cell Biol. 2007 Jun;9(6):625-35. doi: 10.1038/ncb1589. Epub 2007 May 21. Nat Cell Biol. 2007. PMID: 17515932 - Orphan nuclear receptor GCNF is required for the repression of pluripotency genes during retinoic acid-induced embryonic stem cell differentiation.
Gu P, LeMenuet D, Chung AC, Mancini M, Wheeler DA, Cooney AJ. Gu P, et al. Mol Cell Biol. 2005 Oct;25(19):8507-19. doi: 10.1128/MCB.25.19.8507-8519.2005. Mol Cell Biol. 2005. PMID: 16166633 Free PMC article. - Differential roles for Sox15 and Sox2 in transcriptional control in mouse embryonic stem cells.
Maruyama M, Ichisaka T, Nakagawa M, Yamanaka S. Maruyama M, et al. J Biol Chem. 2005 Jul 1;280(26):24371-9. doi: 10.1074/jbc.M501423200. Epub 2005 Apr 29. J Biol Chem. 2005. PMID: 15863505 - The molecular mechanism of embryonic stem cell pluripotency and self-renewal.
Liu Y, Ji L, Ten Y, Wang Y, Pei X. Liu Y, et al. Sci China C Life Sci. 2007 Oct;50(5):619-23. doi: 10.1007/s11427-007-0074-5. Sci China C Life Sci. 2007. PMID: 17879059 Review. - [Mechanism for maintaining pluripotency in embryonic stem cells and inner cell mass].
Nakagawa M, Yamanaka S. Nakagawa M, et al. Tanpakushitsu Kakusan Koso. 2005 May;50(6 Suppl):546-50. Tanpakushitsu Kakusan Koso. 2005. PMID: 15926478 Review. Japanese. No abstract available.
Cited by
- A focused microarray for screening rat embryonic stem cell lines.
Hong J, He H, Bui P, Ryba-White B, Rumi MA, Soares MJ, Dutta D, Paul S, Kawamata M, Ochiya T, Ying QL, Rajanahalli P, Weiss ML. Hong J, et al. Stem Cells Dev. 2013 Feb 1;22(3):431-43. doi: 10.1089/scd.2012.0279. Epub 2012 Sep 28. Stem Cells Dev. 2013. PMID: 22889370 Free PMC article. - Epigenetic reprogramming and induced pluripotency.
Hochedlinger K, Plath K. Hochedlinger K, et al. Development. 2009 Feb;136(4):509-23. doi: 10.1242/dev.020867. Development. 2009. PMID: 19168672 Free PMC article. Review. - The different shades of mammalian pluripotent stem cells.
Kuijk EW, Chuva de Sousa Lopes SM, Geijsen N, Macklon N, Roelen BA. Kuijk EW, et al. Hum Reprod Update. 2011 Mar-Apr;17(2):254-71. doi: 10.1093/humupd/dmq035. Epub 2010 Aug 12. Hum Reprod Update. 2011. PMID: 20705693 Free PMC article. Review. - Direct reprogramming of mouse and human fibroblasts into multipotent neural stem cells with a single factor.
Ring KL, Tong LM, Balestra ME, Javier R, Andrews-Zwilling Y, Li G, Walker D, Zhang WR, Kreitzer AC, Huang Y. Ring KL, et al. Cell Stem Cell. 2012 Jul 6;11(1):100-9. doi: 10.1016/j.stem.2012.05.018. Epub 2012 Jun 7. Cell Stem Cell. 2012. PMID: 22683203 Free PMC article. - Conversion of mouse epiblast stem cells to an earlier pluripotency state by small molecules.
Zhou H, Li W, Zhu S, Joo JY, Do JT, Xiong W, Kim JB, Zhang K, Schöler HR, Ding S. Zhou H, et al. J Biol Chem. 2010 Sep 24;285(39):29676-80. doi: 10.1074/jbc.C110.150599. Epub 2010 Aug 12. J Biol Chem. 2010. PMID: 20705612 Free PMC article.
References
Publication types
MeSH terms
Substances
LinkOut - more resources
Full Text Sources
Other Literature Sources
Medical
Miscellaneous
