Macromolecular-scale resolution in biological fluorescence microscopy - PubMed (original) (raw)
Macromolecular-scale resolution in biological fluorescence microscopy
Gerald Donnert et al. Proc Natl Acad Sci U S A. 2006.
Abstract
We demonstrate far-field fluorescence microscopy with a focal-plane resolution of 15-20 nm in biological samples. The 10- to 12-fold multilateral increase in resolution below the diffraction barrier has been enabled by the elimination of molecular triplet state excitation as a major source of photobleaching of a number of dyes in stimulated emission depletion microscopy. Allowing for relaxation of the triplet state between subsequent excitation-depletion cycles yields an up to 30-fold increase in total fluorescence signal as compared with reported stimulated emission depletion illumination schemes. Moreover, it enables the reduction of the effective focal spot area by up to approximately 140-fold below that given by diffraction. Triplet-state relaxation can be realized either by reducing the repetition rate of pulsed lasers or by increasing the scanning speed such that the build-up of the triplet state is effectively prevented. This resolution in immunofluorescence imaging is evidenced by revealing nanoscale protein patterns on endosomes, the punctuated structures of intermediate filaments in neurons, and nuclear protein speckles in mammalian cells with conventional optics. The reported performance of diffraction-unlimited fluorescence microscopy opens up a pathway for addressing fundamental problems in the life sciences.
Conflict of interest statement
Conflict of interest statement: No conflicts declared.
Figures
Fig. 1.
STED microscopy operation with interpulse time interval Δ_t_. (a Left and Center) Measured focal spots (PSFs) for excitation (Exc; Left) (wavelength, 470 nm; blue) and STED (Center) (603 nm, orange). The blue spot of excitation light features a FWHM of 190 nm. (a Right) Applying a crest intensity Î_STEDmax yields the 22-nm effective (Eff) spot shown in green. (b) Fluorophore energy levels and potential bleaching pathways. Fluorescence from S1 is suppressed by stimulated emission. Stimulated emission may also excite the dye to a higher singlet state Sx, from which the molecule can cross to the triplet system Tx. In regions of weak STED pulse intensity, the molecule can directly cross to the T1 featuring a lifetime τT = 0.5–3 μs. Excitation of T1 molecules by subsequent pulses leads to reverse intersystem crossing or augmented photobleaching. (c) These adverse effects are counteracted by Δ_t > τT. Note the dramatic reduction in the focal spot area in a, resulting from STED.
Fig. 2.
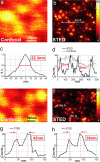
Resolution ≤20 nm in the focal plane of a STED microscope demonstrated with fluorescent nanobeads. Whereas the confocal imaging mode (a and e) fails to resolve the bead agglomeration, the corresponding STED recording (b and f) discerns every 24-nm bead. (c) Averaged profile of bead images. The 22.3-nm FWHM indicates a lateral resolution of ≈16 nm in the focal plane (after extraction of the bead size). (d) Data as indicated by the dashed line in b both for the confocal and the STED recording. Note the sharp peaks resulting from STED superresolution. (g and h) Intensity profiles through the data in f proving the separation capability of the STED microscope.
Fig. 3.
Synaptotagmin I molecules form distinct spots on endosomes. (a and b) Whereas confocal microscopy exhibits a 190- to 200-nm diffraction-limited spot per endosome (a), STED microscopy recognizes sharp dots of 25–40 nm (b), both indicating its resolution as well as the punctated spatial arrangement of synaptotagmin I on the endosome. (c and d) Corresponding intensity profiles.
Fig. 4.
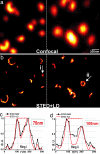
Synaptophysin forms elaborate nanopatterns on endosomes. (a) Confocal reference. (b) STED microscopy plus a LD (see Material and Methods) revealing ring-like and C-shaped nanoarrangements. (c and d) Line profiles through rings, both of the LD (red line) and of the raw STED data (black, with pixels).
Fig. 5.
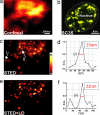
Resolving the nanostructure of speckles of protein SC35 in intact mammalian cell nuclei. (a, c, and e) Confocal image of a speckle domain (a) with STED counterpart data, raw (c) and after LD (e). (b) Conventional overview image of speckles in nucleus. (d and f) Raw data profiles through speckle nanofeatures indicate a STED microscopy lateral resolution of ≈20 nm in the nucleus.
Fig. 6.
Imaging neurofilaments in human neuroblastoma. (a Inset) Low-magnification confocal image indicates the site of recording. (a_–_d) Contrary to the confocal recording (a), the STED recording (b) displays details <30 nm, as also highlighted by the comparison of image subregions shown in c and d bordered by dashed lines in a and b, respectively. (c and e) Subregion after LD. Note that the deconvolved confocal image does not yield a substantial gain in information. (f) Profiles of raw data demonstrate the ability of (undeconvolved) STED data to reveal object structures that are far below the wavelength of light.
Similar articles
- STED microscopy with continuous wave beams.
Willig KI, Harke B, Medda R, Hell SW. Willig KI, et al. Nat Methods. 2007 Nov;4(11):915-8. doi: 10.1038/nmeth1108. Epub 2007 Oct 21. Nat Methods. 2007. PMID: 17952088 - STED microscopy with a supercontinuum laser source.
Wildanger D, Rittweger E, Kastrup L, Hell SW. Wildanger D, et al. Opt Express. 2008 Jun 23;16(13):9614-21. doi: 10.1364/oe.16.009614. Opt Express. 2008. PMID: 18575529 - Upgrade of a Scanning Confocal Microscope to a Single-Beam Path STED Microscope.
Klauss A, König M, Hille C. Klauss A, et al. PLoS One. 2015 Jun 19;10(6):e0130717. doi: 10.1371/journal.pone.0130717. eCollection 2015. PLoS One. 2015. PMID: 26091552 Free PMC article. - STED microscopy for nanoscale imaging in living brain slices.
Chéreau R, Tønnesen J, Nägerl UV. Chéreau R, et al. Methods. 2015 Oct 15;88:57-66. doi: 10.1016/j.ymeth.2015.06.006. Epub 2015 Jun 9. Methods. 2015. PMID: 26070997 Review. - Nanoscale imaging by superresolution fluorescence microscopy and its emerging applications in biomedical research.
Bertocchi C, Goh WI, Zhang Z, Kanchanawong P. Bertocchi C, et al. Crit Rev Biomed Eng. 2013;41(4-5):281-308. doi: 10.1615/critrevbiomedeng.2014010448. Crit Rev Biomed Eng. 2013. PMID: 24941410 Review.
Cited by
- Subdiffraction Imaging of Cleared and Expanded Large-Scale Tissues.
Zhang Y, Wu W, Shen H, Xu J, Jiang Q, Han X, Cai P. Zhang Y, et al. Chem Biomed Imaging. 2024 Jun 18;2(8):542-559. doi: 10.1021/cbmi.4c00013. eCollection 2024 Aug 26. Chem Biomed Imaging. 2024. PMID: 39473992 Free PMC article. Review. - The ATTO 565 Dye and Its Applications in Microscopy.
Wu Y, Williams RM. Wu Y, et al. Molecules. 2024 Sep 6;29(17):4243. doi: 10.3390/molecules29174243. Molecules. 2024. PMID: 39275091 Free PMC article. Review. - Cell-cell communication: new insights and clinical implications.
Su J, Song Y, Zhu Z, Huang X, Fan J, Qiao J, Mao F. Su J, et al. Signal Transduct Target Ther. 2024 Aug 7;9(1):196. doi: 10.1038/s41392-024-01888-z. Signal Transduct Target Ther. 2024. PMID: 39107318 Free PMC article. Review. - Optical super-resolution nanothermometry via stimulated emission depletion imaging of upconverting nanoparticles.
Ye Z, Harrington B, Pickel AD. Ye Z, et al. Sci Adv. 2024 Jul 19;10(29):eado6268. doi: 10.1126/sciadv.ado6268. Epub 2024 Jul 17. Sci Adv. 2024. PMID: 39018395 Free PMC article. - Infrared nanoimaging of neuronal ultrastructure and nanoparticle interaction with cells.
Greaves GE, Allison L, Machado P, Morfill C, Fleck RA, Porter AE, Phillips CC. Greaves GE, et al. Nanoscale. 2024 Mar 21;16(12):6190-6198. doi: 10.1039/d3nr04948e. Nanoscale. 2024. PMID: 38445876 Free PMC article.
References
- Abbe E. Arch. Mikrosk. Anat. Entwicklungsmech. 1873;9:413–420.
- Hell S. W. Opt. Commun. 1994;106:19–22.
- Hell S. W., Wichmann J. Opt. Lett. 1994;19:780–782. - PubMed
- Klar T. A., Hell S. W. Opt. Lett. 1999;24:954–956. - PubMed
Publication types
MeSH terms
Substances
LinkOut - more resources
Full Text Sources
Other Literature Sources


