Visualizing single molecules interacting with nuclear pore complexes by narrow-field epifluorescence microscopy - PubMed (original) (raw)
Visualizing single molecules interacting with nuclear pore complexes by narrow-field epifluorescence microscopy
Weidong Yang et al. Methods. 2006 Aug.
Abstract
The utility of single molecule fluorescence (SMF) for understanding biological reactions has been amply demonstrated by a diverse series of studies over the last decade. In large part, the molecules of interest have been limited to those within a small focal volume or near a surface to achieve the high sensitivity required for detecting the inherently weak signals arising from individual molecules. Consequently, the investigation of molecular behavior with high time and spatial resolution deep within cells using SMF has remained challenging. Recently, we demonstrated that narrow-field epifluorescence microscopy allows visualization of nucleocytoplasmic transport at the single cargo level. We describe here the methodological approach that yields 2 ms and approximately 15 nm resolution for a stationary particle. The spatial resolution for a mobile particle is inherently worse, and depends on how fast the particle is moving. The signal-to-noise ratio is sufficiently high to directly measure the time a single cargo molecule spends interacting with the nuclear pore complex. Particle tracking analysis revealed that cargo molecules randomly diffuse within the nuclear pore complex, exiting as a result of a single rate-limiting step. We expect that narrow-field epifluorescence microscopy will be useful for elucidating other binding and trafficking events within cells.
Figures
Fig. 1
The nuclear pore complex. Reproduced and modified with permission from the authors and from Nature Reviews (
) Molecular Cell Biology [1] copyright (2003) Macmillan Magazines Ltd. The original figure was modeled and prepared by D. Stoffler using ViPEr, a Visual Programming Environment, that was developed by D. Stoffler and M. Sanner at The Scripps Research Institute, La Jolla, California, USA.
Fig. 2
Transport pathways involved in NLS-mediated nuclear import. Nuclear localization sequences (NLSs) are typically recognized by a member of the importin-β family of import receptors. Sometimes an adaptor protein is required. In the case of the NLS of the SV40 large T antigen, this adaptor protein is importin-α [38]. The import complex (importin(s) plus cargo) is dissociated by Ran-GTP. Importins are recycled by export from the nucleus in a complex with Ran-GTP; as for import, sometimes an additional cofactor is required (e.g., CAS for importin-α). RanGAP activates the Ran GTPase, leading to GTP hydrolysis and dissociation of export cargo. Ran-GDP is recycled back to the nucleus with the assistance of NTF2. The chromosome-bound RanGEF catalyzes GDP/GTP exchange. See text for additional details.
Fig. 3
Narrow-field epifluorescence microscopy. This schematic shows the essential features of a narrow-field epifluorescence microscope setup that can be used for SMF. A quarter-wave (λ/4) plate is used to convert linearly polarized laser light to a circularly polarized beam, which is expanded to overfill the back aperture of the objective. A pinhole (typically 200–500 μm diameter) at a conjugate image plane confines the laser beam, reducing the illumination area within the image plane. The laser beam is converted to a diverging beam such that it focuses beyond the image plane.
Fig. 4
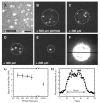
Effect of pinhole size in narrow-field epifluorescence microscopy. The model cargo NLS-2×GFP(4C) labeled with four Alexa647 molecules was absorbed onto a coverslip surface. The effect of illumination area on S/N was then examined by narrow-field epifluorescence microscopy: (A) without pinhole; (B–E) with pinholes ranging from 200 to 500 μm as indicated; (F) 500 μm pinhole with higher protein concentration to coat surface, showing the effective illumination area. Dashed circles show the approximate illumination area. Camera gain was identical for all images, and optical densities (laser power/illumination area) were kept approximately constant (∼2 kW/ μm2) by adjusting the laser power as necessary. Note the significant reduction in background noise when a pinhole was present. Bar: 5 μm. (G) S/N as a function of pinhole size. Data (mean ± SE; N = 20 for each point) were collected as in A–E. “Infinite” denotes the condition with no pinhole. (H) Emission intensity across the illuminated area in (F) at the position defined by the black horizontal line. The full-width at half-maximum was ∼13 μm, and the intensity distribution was nearly flat for the central ∼9 μm diameter area.
Fig. 5
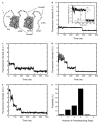
Photobleaching of NLS-2×GFP(4C) labeled with four Alexa647 molecules. (A) The NLS-2×GFP(4C) model cargo. Two identical GFP domains, represented here by structural models (PDB accession number 1C4F), have N- and C-terminal extensions and are linked by the peptide shown. The four identified cysteines (one in the linker, one in the C-terminal extension, and the S175C mutations in each of the two GFP domains) can each be labeled with a molecule of Alexa647 maleimide. The two wildtype cysteines in each GFP domain are unreactive toward maleimides. The N-terminal extension contains a nuclear localization sequence (NLS; PPKKKRKV) that targets the protein for importin-α/β-dependent transport. The indicated K → T mutation in the NLS blocks recognition by importin-α. The 6×His-tag assists with purification. (B–E) Photobleaching profile of an NLS-2×GFP(4C) cargo molecule labeled with (B) one, (C) two, (D) three, or (E) four Alexa647 molecules. Since each Alexa647 molecule exhibits quantized photobleaching, the number of dyes on the cargo can be determined by counting the number of photobleaching steps. The fluorescence intensity was integrated over a 6 × 6 pixel area. Inset in (B): expanded view of the photobleaching event. The signal intensity (_S = I_o − _I_b) is estimated from the average intensities observed before (_I_0) and after (_I_b) photobleaching. The standard deviation in the intensity while the dye is fluorescent (_σ_o) is typically larger than the baseline noise (_σ_b). The S/N is defined by Eq. (2). (F) Probability histogram for the number of photobleaching steps observed for individual cargo molecules. A sample from a preparation of NLS-2×GFP(4C) labeled with Alexa647 was immobilized on a coverslip surface, and the photobleaching profiles were determined as in B–E (N = 235). From these data, the average labeling ratio was calculated as 3.5 dye molecules per cargo molecule, in excellent agreement with the ratio (also 3.5) determined from absorption measurements of the labeled protein stock solution.
Fig. 6
Precision depends on the S/N. (A) Localization precision for coverslip-adsorbed NLS-2×GFP(4C) molecules labeled with Alexa555. The S/N likely depended on the number of attached dye molecules and differential effects of surface adsorption (which can affect dye orientation and focal clarity). A modest improvement in average S/N (from ∼11.1 to ∼13.7) was observed when a pinhole (300 μm) was included in the emission path (open circles), compared to the S/N obtained without such a confocal-type arrangement (filled circles). The corresponding increase in average precision was ∼4 nm (from ∼20 to ∼16 nm). The Cascade128+ camera chip was cooled to −5 °C. Illumination area: ∼8 μm (400 μm excitation side pinhole). Acquisition speed: 2 ms per frame. (B) Localization precision for coverslip-adsorbed NLS-2×GFP(4C) molecules labeled with Alexa647. The CCD camera chip was cooled to −30 °C and the images were Gaussian filtered (3 × 3 kernel) before further processing. As a result of the additional cooling and Gaussian filtering, the average S/N increased by ∼0.8 (from ∼11.1 to ∼11.9), and the precision increased by ∼5 nm (from ∼20 to ∼15 nm; compare the filled circles in A and B). The significant increase in precision with only a minor increase in the S/N is largely a consequence of the Gaussian filtering, a processing technique that does not substantially change the S/N but does significantly improve the localization precision. Acquisition speed: 2 ms per frame.
Similar articles
- Single-molecule imaging of nuclear transport.
Goryaynov A, Sarma A, Ma J, Yang W. Goryaynov A, et al. J Vis Exp. 2010 Jun 9;(40):2040. doi: 10.3791/2040. J Vis Exp. 2010. PMID: 20548283 Free PMC article. - Imaging of single-molecule translocation through nuclear pore complexes.
Yang W, Gelles J, Musser SM. Yang W, et al. Proc Natl Acad Sci U S A. 2004 Aug 31;101(35):12887-92. doi: 10.1073/pnas.0403675101. Epub 2004 Aug 11. Proc Natl Acad Sci U S A. 2004. PMID: 15306682 Free PMC article. - Binding site distribution of nuclear transport receptors and transport complexes in single nuclear pore complexes.
Kahms M, Lehrich P, Hüve J, Sanetra N, Peters R. Kahms M, et al. Traffic. 2009 Sep;10(9):1228-42. doi: 10.1111/j.1600-0854.2009.00947.x. Epub 2009 May 27. Traffic. 2009. PMID: 19548985 - Distinct, but not completely separate spatial transport routes in the nuclear pore complex.
Yang W. Yang W. Nucleus. 2013 May-Jun;4(3):166-75. doi: 10.4161/nucl.24874. Epub 2013 May 1. Nucleus. 2013. PMID: 23669120 Free PMC article. Review. - Single-molecule studies of nucleocytoplasmic transport: from one dimension to three dimensions.
Goryaynov A, Ma J, Yang W. Goryaynov A, et al. Integr Biol (Camb). 2012 Jan;4(1):10-21. doi: 10.1039/c1ib00041a. Epub 2011 Oct 24. Integr Biol (Camb). 2012. PMID: 22020388 Free PMC article. Review.
Cited by
- Calcium regulation of nucleocytoplasmic transport.
Sarma A, Yang W. Sarma A, et al. Protein Cell. 2011 Apr;2(4):291-302. doi: 10.1007/s13238-011-1038-x. Epub 2011 Apr 27. Protein Cell. 2011. PMID: 21528351 Free PMC article. Review. - Super-resolution 3D tomography of interactions and competition in the nuclear pore complex.
Ma J, Goryaynov A, Yang W. Ma J, et al. Nat Struct Mol Biol. 2016 Mar;23(3):239-47. doi: 10.1038/nsmb.3174. Epub 2016 Feb 15. Nat Struct Mol Biol. 2016. PMID: 26878241 Free PMC article. - Investigating molecular crowding within nuclear pores using polarization-PALM.
Fu G, Tu LC, Zilman A, Musser SM. Fu G, et al. Elife. 2017 Sep 26;6:e28716. doi: 10.7554/eLife.28716. Elife. 2017. PMID: 28949296 Free PMC article. - High-speed super-resolution imaging of rotationally symmetric structures using SPEED microscopy and 2D-to-3D transformation.
Li Y, Tingey M, Ruba A, Yang W. Li Y, et al. Nat Protoc. 2021 Jan;16(1):532-560. doi: 10.1038/s41596-020-00440-x. Epub 2020 Dec 14. Nat Protoc. 2021. PMID: 33318694 Free PMC article. - Choreography of importin-α/CAS complex assembly and disassembly at nuclear pores.
Sun C, Fu G, Ciziene D, Stewart M, Musser SM. Sun C, et al. Proc Natl Acad Sci U S A. 2013 Apr 23;110(17):E1584-93. doi: 10.1073/pnas.1220610110. Epub 2013 Apr 8. Proc Natl Acad Sci U S A. 2013. PMID: 23569239 Free PMC article.
References
- Fahrenkrog B, Aebi U. Nat Rev Mol Cell Biol. 2003;4:757–766. - PubMed
- Rout MP, Aitchison JD. J Biol Chem. 2001;276:16593–16596. - PubMed
- Stoffler D, Feja B, Fahrenkorg B, Walz J, Typke D, Aebi U. J Mol Biol. 2003;328:119–130. - PubMed
Publication types
MeSH terms
Substances
LinkOut - more resources
Full Text Sources


