Hotspots of transcription factor colocalization in the genome of Drosophila melanogaster - PubMed (original) (raw)
Hotspots of transcription factor colocalization in the genome of Drosophila melanogaster
Celine Moorman et al. Proc Natl Acad Sci U S A. 2006.
Abstract
Regulation of gene expression is a highly complex process that requires the concerted action of many proteins, including sequence-specific transcription factors, cofactors, and chromatin proteins. In higher eukaryotes, the interplay between these proteins and their interactions with the genome still is poorly understood. We systematically mapped the in vivo binding sites of seven transcription factors with diverse physiological functions, five cofactors, and two heterochromatin proteins at approximately 1-kb resolution in a 2.9 Mb region of the Drosophila melanogaster genome. Surprisingly, all tested transcription factors and cofactors show strongly overlapping localization patterns, and the genome contains many "hotspots" that are targeted by all of these proteins. Several control experiments show that the strong overlap is not an artifact of the techniques used. Colocalization hotspots are 1-5 kb in size, spaced on average by approximately 50 kb, and preferentially located in regions of active transcription. We provide evidence that protein-protein interactions play a role in the hotspot association of some transcription factors. Colocalization hotspots constitute a previously uncharacterized type of feature in the genome of Drosophila, and our results provide insights into the general targeting mechanisms of transcription regulators in a higher eukaryote.
Conflict of interest statement
Conflict of interest statement: No conflicts declared.
Figures
Fig. 1.
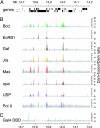
Detailed view of DamID profiles generated by using genomic tiling arrays. (A) Predicted genes in a 0.5-Mb section of the Adh-cactus region (position 13,700,381 to 14,199,715 on chromosome 2L) of Drosophila. (B) DamID binding ratios of seven transcription factors and Pol II. (C) DamID binding ratios of Gal4p-DBD. Ratios that are statistically significant and at least 2-fold above background are highlighted by colors in B and C.
Fig. 2.
Complete view of DamID profiles of the entire 2.9-Mb Adh-cactus region. (A) DamID data for all 14 Drosophila proteins that were studied. Each probe on the array is represented by a vertical line, the color of which indicates the relative binding of the protein (ranging from white equals background level to black equals strongest binding). (B) Location of hotspots, i.e., probes that are part of cluster 1 in Fig. 4_B_. (C) Location of all predicted genes in the probed region. Genes that overlap with at least one hotspot are highlighted in orange, and their names are indicated.
Fig. 4.
Definition of hotspot regions and other types of chromatin by SOM analysis and K means clustering of DamID profiles of 14 proteins. (A) SOM analysis visualized for each protein in SOM component planes consisting of a matrix of 24 × 12 hexagonal nodes. Each node includes tiling array fragments with similar binding behavior across all 14 DamID profiles. Nodes that are close to each other in the SOM component plane are more alike than nodes that are farther away. The color scale represents the mean binding Z score in each node. (B Left) Further simplification of SOM data by adaptive K means clustering, resulting in the classification of the combined protein-binding patterns into eight types of chromatin, each marked in a different color. (B Right) The area of each node reflects the number of tiling array fragments included in that node. (C) DamID profile of GAL4-DBD and ChIP profile of Gaf visualized in the same SOM matrix as in A and B. (D) DamID profiles of Bcd DBD and BcdK50A visualized in the same SOM matrix as in A and B. BcdK50A binds strongly to the hotspots (“type 1,” outlined by a white line), whereas Bcd DBD does not. (E) SOM matrix visualization of (from left to right) DamID profile of the 18-kDa subunit of Pol II, ChIP profile of the CTD subunit of Pol II (data from ref. 27), mRNA expression levels (data from ref. 27), and histone H3.3 over H3 ratios (data from ref. 28). Note the enrichment of all of these transcription-related marks in the hotspot cluster (outlined by a white line).
Fig. 3.
Comparison of Gaf DamID to Gaf ChIP. Gaf DamID-binding ratios across the entire 2.9 Mb Adh-cactus region are plotted on the positive y axis (dark blue), and Gaf ChIP-binding ratios are plotted on the negative y axis (light blue).
Fig. 5.
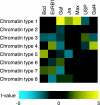
Sequence signals enriched in the eight different chromatin types shown in Fig. 4_B_. Information from the TRANSFAC (30) and JASPAR (31) databases was used to construct a position-specific affinity matrix (31) representing the sequence specificity of each transcription factor. Each position-specific affinity matrix was used to predict a profile along the entire Adh-cactus region of the binding affinity relative to the optimal binding sequence. Difference between average for probed regions of a given chromatin type (see Fig. 4_B_) and all other regions, represented as a t value computed by using a paired t test. Note the increased predicted affinity of colocalization hotspots (type 1 regions) for Gaf, Jra, and Max.
Fig. 6.
Different developmental expression profiles of hotspot-containing genes (red) compared with hotspot-free genes (black) in the Adh-cactus region. Values indicate mean log2 expression levels (arbitrary units; data taken from ref. 34). P values indicate the statistical significance of the difference for each developmental stage (Wilcoxon test, Bonferroni-corrected for multiple testing); NS, not significant (P > 0.01).
Similar articles
- The role of chromatin accessibility in directing the widespread, overlapping patterns of Drosophila transcription factor binding.
Li XY, Thomas S, Sabo PJ, Eisen MB, Stamatoyannopoulos JA, Biggin MD. Li XY, et al. Genome Biol. 2011;12(4):R34. doi: 10.1186/gb-2011-12-4-r34. Epub 2011 Apr 7. Genome Biol. 2011. PMID: 21473766 Free PMC article. - Quantitative models of the mechanisms that control genome-wide patterns of transcription factor binding during early Drosophila development.
Kaplan T, Li XY, Sabo PJ, Thomas S, Stamatoyannopoulos JA, Biggin MD, Eisen MB. Kaplan T, et al. PLoS Genet. 2011 Feb 3;7(2):e1001290. doi: 10.1371/journal.pgen.1001290. PLoS Genet. 2011. PMID: 21304941 Free PMC article. - Developmental roles of 21 Drosophila transcription factors are determined by quantitative differences in binding to an overlapping set of thousands of genomic regions.
MacArthur S, Li XY, Li J, Brown JB, Chu HC, Zeng L, Grondona BP, Hechmer A, Simirenko L, Keränen SV, Knowles DW, Stapleton M, Bickel P, Biggin MD, Eisen MB. MacArthur S, et al. Genome Biol. 2009;10(7):R80. doi: 10.1186/gb-2009-10-7-r80. Epub 2009 Jul 23. Genome Biol. 2009. PMID: 19627575 Free PMC article. - Chromatin Immunoprecipitation for Analyzing Transcription Factor Binding and Histone Modifications in Drosophila.
Ghavi-Helm Y, Zhao B, Furlong EE. Ghavi-Helm Y, et al. Methods Mol Biol. 2016;1478:263-277. doi: 10.1007/978-1-4939-6371-3_16. Methods Mol Biol. 2016. PMID: 27730588 Review. - Transcriptional regulation in Drosophila: the post-genome challenge.
Biggin MD, Tjian R. Biggin MD, et al. Funct Integr Genomics. 2001 Mar;1(4):223-34. doi: 10.1007/s101420000021. Funct Integr Genomics. 2001. PMID: 11793241 Review.
Cited by
- Occupancy maps of 208 chromatin-associated proteins in one human cell type.
Partridge EC, Chhetri SB, Prokop JW, Ramaker RC, Jansen CS, Goh ST, Mackiewicz M, Newberry KM, Brandsmeier LA, Meadows SK, Messer CL, Hardigan AA, Coppola CJ, Dean EC, Jiang S, Savic D, Mortazavi A, Wold BJ, Myers RM, Mendenhall EM. Partridge EC, et al. Nature. 2020 Jul;583(7818):720-728. doi: 10.1038/s41586-020-2023-4. Epub 2020 Jul 29. Nature. 2020. PMID: 32728244 Free PMC article. - The RNA Pol II elongation factor Ell3 marks enhancers in ES cells and primes future gene activation.
Lin C, Garruss AS, Luo Z, Guo F, Shilatifard A. Lin C, et al. Cell. 2013 Jan 17;152(1-2):144-56. doi: 10.1016/j.cell.2012.12.015. Epub 2012 Dec 27. Cell. 2013. PMID: 23273992 Free PMC article. - Binding profiles for 954 Drosophila and C. elegans transcription factors reveal tissue specific regulatory relationships.
Kudron M, Gevirtzman L, Victorsen A, Lear BC, Gao J, Xu J, Samanta S, Frink E, Tran-Pearson A, Huynh C, Vafeados D, Hammonds A, Fisher W, Wall M, Wesseling G, Hernandez V, Lin Z, Kasparian M, White K, Allada R, Gerstein M, Hillier L, Celniker SE, Reinke V, Waterston RH. Kudron M, et al. bioRxiv [Preprint]. 2024 Jan 20:2024.01.18.576242. doi: 10.1101/2024.01.18.576242. bioRxiv. 2024. PMID: 38293065 Free PMC article. Updated. Preprint. - Super-enhancers in transcriptional regulation and genome organization.
Wang X, Cairns MJ, Yan J. Wang X, et al. Nucleic Acids Res. 2019 Dec 16;47(22):11481-11496. doi: 10.1093/nar/gkz1038. Nucleic Acids Res. 2019. PMID: 31724731 Free PMC article. - On the use of resampling tests for evaluating statistical significance of binding-site co-occurrence.
Huen DS, Russell S. Huen DS, et al. BMC Bioinformatics. 2010 Jun 30;11:359. doi: 10.1186/1471-2105-11-359. BMC Bioinformatics. 2010. PMID: 20591178 Free PMC article.
References
- Chua G., Robinson M. D., Morris Q., Hughes T. R. Curr. Opin. Microbiol. 2004;7:638–646. - PubMed
- Siggia E. D. Curr. Opin. Genet. Dev. 2005;15:214–221. - PubMed
- Bertone P., Gerstein M., Snyder M. Chromosome Res. 2005;13:259–274. - PubMed
- Blais A., Dynlacht B. D. Genes Dev. 2005;19:1499–1511. - PubMed
Publication types
MeSH terms
Substances
Grants and funding
- T32 GM082797/GM/NIGMS NIH HHS/United States
- R01 HG003008/HG/NHGRI NIH HHS/United States
- CA12152/CA/NCI NIH HHS/United States
- R01 HG03231/HG/NHGRI NIH HHS/United States
- HG003008/HG/NHGRI NIH HHS/United States
- R01 HG003231/HG/NHGRI NIH HHS/United States
- R24 GM074105/GM/NIGMS NIH HHS/United States
LinkOut - more resources
Full Text Sources
Other Literature Sources
Molecular Biology Databases
Research Materials
Miscellaneous


