Phosphoinositide 3-kinase regulatory subunit p85alpha suppresses insulin action via positive regulation of PTEN - PubMed (original) (raw)
Phosphoinositide 3-kinase regulatory subunit p85alpha suppresses insulin action via positive regulation of PTEN
Cullen M Taniguchi et al. Proc Natl Acad Sci U S A. 2006.
Erratum in
- Correction for Taniguchi et al., Phosphoinositide 3-kinase regulatory subunit p85α suppresses insulin action via positive regulation of PTEN.
[No authors listed] [No authors listed] Proc Natl Acad Sci U S A. 2016 Jun 21;113(25):E3588. doi: 10.1073/pnas.1607478113. Epub 2016 Jun 2. Proc Natl Acad Sci U S A. 2016. PMID: 27330087 Free PMC article. No abstract available.
Abstract
The phosphoinositide 3-kinase (PI3K) pathway is central to the metabolic actions of insulin on liver. Here, we show that mice with a liver-specific deletion of the p85alpha regulatory subunit of PI3K (L-Pik3r1KO) exhibit a paradoxical improvement of hepatic and peripheral insulin sensitivity. Although PI3K enzymatic activity is diminished in L-Pik3r1KO livers because of a reduced level of regulatory and catalytic subunits of PI3K, insulin-stimulated Akt activity is actually increased. This increased Akt activity correlates with increased phosphatidylinositol (3,4,5)-trisphosphate levels which are due, at least in part, to diminished activity of the (3,4,5)-trisphosphate phosphatase PTEN. Thus, the regulatory subunit p85alpha is a critical modulator of insulin sensitivity in vivo not only because of its effects on PI3K activation, but also as a regulator of PTEN activity.
Conflict of interest statement
Conflict of interest statement: No conflicts declared.
Figures
Fig. 1.
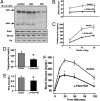
Metabolic phenotype of L-Pik3r1KO mice. (A) Western blots for Pik3r1 gene products with an antibody against the N-terminal SH2 domain (pan-p85) in tissue lysates, as indicated, from control, heterozygous KO, and L-Pik3r1KO mice. Tissues were collected from mice after an overnight fast, and proteins were extracted and processed as described in Materials and Methods. Each lane represents lysates from a different mouse. (B and C) Fasted blood glucose and fasted serum insulin levels. (D and E) Serum triglycerides and serum nonesterified free fatty acid (FFA) levels from lox/lox or KO mice in the fasted state. (F) Glucose tolerance tests (2 g/kg, i.p.) were performed on mice after a 16-h fast, and blood samples were collected and glucose measured at the times indicated. All values are presented as mean ± SEM (n = 6–20). Open circles, lox/lox; filled circles, L-Pik3r1KO.
Fig. 2.
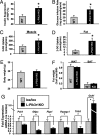
Hyperinsulinemic–euglycemic clamp analyses and gene expression changes in lox/lox (WT) and L-Pik3r1KO mice. We subjected male mice (n = 11) of the indicated genotype at 10–12 weeks of age to hyperinsulinemic–euglycemic clamp analysis and measured insulin suppression of HGP (A), glucose infusion rates (B), and in vivo 14C-deoxyglucose uptake in muscle (C) and epididymal fat tissue (D). (E and F) Weight of entire animals or of epididymal (WAT) and brown (BAT) fat pads. WAT and BAT are expressed as a percentage of body weight. (G) Quantitative RT-PCR analysis of mRNA levels in lox/lox and L-Pik3r1KO mice of phosphoenolpyruvate carboxykinase (Pck1), glucose-6-phosphatase (G6Pc), fructose-1,6-bisphosphatase (Fbp1), peroxisome proliferator-activated receptor (PPAR) γ coactivator 1α (Ppargc1), tribbles3 (trib3), and glucokinase (Gck1). n = 8 for each genotype for RT-PCR experiments. ∗, P < 0.05 vs. lox/lox mice.
Fig. 3.
Enhanced Akt activation in L-Pik3r1KO mice. (A) PI3K activity in IRS-1, IRS-2, and pTyr immunoprecipitates (bars represent mean ± SEM; n = 5; ∗, P < 0.05). (B and C) Western blot of p110α and p85α from p110α immunoprecipitates and pTyr and insulin receptor (IR) blots from insulin receptor (β-subunit) immunoprecipitates. (D) Ser-473 phosphorylation of Akt (Upper) and Akt kinase activity as measured from Akt immunoprecipitates by using Crosstide as a substrate (Lower). Bars represent mean ± SEM; n = 8; ∗, P < 0.05 vs. insulin-stimulated lox/lox mice.
Fig. 4.
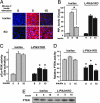
Enhanced PIP3 levels in L-Pik3r1KO mice due to decreased PTEN activity. (A) Immunofluorescent staining with a primary anti-PIP3 antibody (IgM) and an anti-mouse secondary antibody conjugated to Alexa Fluor red and counterstained with DAPI. After an overnight fast, mice were injected with saline (time = 0) or 5 units of insulin for the indicated amount of time. Six mice of each genotype/treatment were fixed via cardiac perfusion of 10% buffered formalin in PBS. (B) Quantification of the immunofluorescence from PIP3 staining. Representative slides were chosen from each mouse, and the fluorescence intensity was measured and analyzed with
vh-h1a5 analyzer
software (KEYENCE, Osaka, Japan). (C and D) Insulin-stimulated pTyr-associated PI3K activity and PTEN activity and PTEN protein levels in lox/lox or KO animals at the indicated time points after insulin stimulation. ∗, P < 0.05 vs. lox/lox after 5 min of insulin stimulation.
Similar articles
- Direct positive regulation of PTEN by the p85 subunit of phosphatidylinositol 3-kinase.
Chagpar RB, Links PH, Pastor MC, Furber LA, Hawrysh AD, Chamberlain MD, Anderson DH. Chagpar RB, et al. Proc Natl Acad Sci U S A. 2010 Mar 23;107(12):5471-6. doi: 10.1073/pnas.0908899107. Epub 2010 Mar 8. Proc Natl Acad Sci U S A. 2010. PMID: 20212113 Free PMC article. - PTEN regulation, a novel function for the p85 subunit of phosphoinositide 3-kinase.
Barber DF, Alvarado-Kristensson M, González-García A, Pulido R, Carrera AC. Barber DF, et al. Sci STKE. 2006 Nov 21;2006(362):pe49. doi: 10.1126/stke.3622006pe49. Sci STKE. 2006. PMID: 17119157 - Increased insulin sensitivity in mice lacking p85beta subunit of phosphoinositide 3-kinase.
Ueki K, Yballe CM, Brachmann SM, Vicent D, Watt JM, Kahn CR, Cantley LC. Ueki K, et al. Proc Natl Acad Sci U S A. 2002 Jan 8;99(1):419-24. doi: 10.1073/pnas.012581799. Epub 2001 Dec 18. Proc Natl Acad Sci U S A. 2002. PMID: 11752399 Free PMC article. - Divergent roles of the regulatory subunits of class IA PI3K.
Kim CW, Lee JM, Park SW. Kim CW, et al. Front Endocrinol (Lausanne). 2024 Jan 22;14:1152579. doi: 10.3389/fendo.2023.1152579. eCollection 2023. Front Endocrinol (Lausanne). 2024. PMID: 38317714 Free PMC article. Review. - Targeting the translational apparatus to improve leukemia therapy: roles of the PI3K/PTEN/Akt/mTOR pathway.
Martelli AM, Evangelisti C, Chappell W, Abrams SL, Bäsecke J, Stivala F, Donia M, Fagone P, Nicoletti F, Libra M, Ruvolo V, Ruvolo P, Kempf CR, Steelman LS, McCubrey JA. Martelli AM, et al. Leukemia. 2011 Jul;25(7):1064-79. doi: 10.1038/leu.2011.46. Epub 2011 Mar 25. Leukemia. 2011. PMID: 21436840 Review.
Cited by
- Chronic Dietary Administration of the Glycolytic Inhibitor 2-Deoxy-D-Glucose (2-DG) Inhibits the Growth of Implanted Ehrlich's Ascites Tumor in Mice.
Singh S, Pandey S, Bhatt AN, Chaudhary R, Bhuria V, Kalra N, Soni R, Roy BG, Saluja D, Dwarakanath BS. Singh S, et al. PLoS One. 2015 Jul 2;10(7):e0132089. doi: 10.1371/journal.pone.0132089. eCollection 2015. PLoS One. 2015. PMID: 26135741 Free PMC article. - Prognostic significance of SOCS1 and SOCS3 tumor suppressors and oncogenic signaling pathway genes in hepatocellular carcinoma.
Khan MGM, Ghosh A, Variya B, Santharam MA, Ihsan AU, Ramanathan S, Ilangumaran S. Khan MGM, et al. BMC Cancer. 2020 Aug 17;20(1):774. doi: 10.1186/s12885-020-07285-3. BMC Cancer. 2020. PMID: 32807134 Free PMC article. - Selective regulation of axonal growth from developing hippocampal neurons by tumor necrosis factor superfamily member APRIL.
Osório C, Chacón PJ, White M, Kisiswa L, Wyatt S, Rodríguez-Tébar A, Davies AM. Osório C, et al. Mol Cell Neurosci. 2014 Mar;59(100):24-36. doi: 10.1016/j.mcn.2014.01.002. Epub 2014 Jan 18. Mol Cell Neurosci. 2014. PMID: 24444792 Free PMC article. - Pioglitazone does not improve insulin signaling in mice with GH over-expression.
Gesing A, Bartke A, Masternak MM. Gesing A, et al. J Endocrinol. 2013 Oct 4;219(2):109-17. doi: 10.1530/JOE-13-0124. Print 2013 Nov. J Endocrinol. 2013. PMID: 23946430 Free PMC article. - Class IA phosphatidylinositol 3-kinase in pancreatic β cells controls insulin secretion by multiple mechanisms.
Kaneko K, Ueki K, Takahashi N, Hashimoto S, Okamoto M, Awazawa M, Okazaki Y, Ohsugi M, Inabe K, Umehara T, Yoshida M, Kakei M, Kitamura T, Luo J, Kulkarni RN, Kahn CR, Kasai H, Cantley LC, Kadowaki T. Kaneko K, et al. Cell Metab. 2010 Dec 1;12(6):619-32. doi: 10.1016/j.cmet.2010.11.005. Cell Metab. 2010. PMID: 21109194 Free PMC article.
References
- Shimomura I., Matsuda M., Hammer R. E., Bashmakov Y., Brown M. S., Goldstein J. L. Mol. Cell. 2000;6:77–86. - PubMed
- Tripathy D., Eriksson K. F., Orho-Melander M., Fredriksson J., Ahlqvist G., Groop L. Diabetologia. 2004;47:782–793. - PubMed
- Saltiel A. R., Kahn C. R. Nature. 2001;414:799–806. - PubMed
- Taniguchi C. M., Emanuelli B., Kahn C. R. Nat. Rev. Mol. Cell Biol. 2006;7:85–96. - PubMed
Publication types
MeSH terms
Substances
Grants and funding
- DK34834/DK/NIDDK NIH HHS/United States
- R01 DK055545/DK/NIDDK NIH HHS/United States
- R37 GM041890/GM/NIGMS NIH HHS/United States
- CA089021/CA/NCI NIH HHS/United States
- R01 GM041890/GM/NIGMS NIH HHS/United States
- R01 DK033201/DK/NIDDK NIH HHS/United States
- DK55545/DK/NIDDK NIH HHS/United States
- DK33201/DK/NIDDK NIH HHS/United States
- P01 CA089021/CA/NCI NIH HHS/United States
- GM41890/GM/NIGMS NIH HHS/United States
LinkOut - more resources
Full Text Sources
Other Literature Sources
Medical
Molecular Biology Databases
Research Materials


