Identification of genomic sites that bind the Drosophila suppressor of Hairy-wing insulator protein - PubMed (original) (raw)
Identification of genomic sites that bind the Drosophila suppressor of Hairy-wing insulator protein
Timothy J Parnell et al. Mol Cell Biol. 2006 Aug.
Abstract
Eukaryotic genomes are divided into independent transcriptional domains by DNA elements known as insulators. The gypsy insulator, a 350-bp element isolated from the Drosophila gypsy retrovirus, contains twelve degenerate binding sites for the Suppressor of Hairy-wing [Su(Hw)] protein. Su(Hw) associates with over 500 non-gypsy genomic sites, the functions of which are largely unknown. Using a bioinformatics approach, we identified 37 putative Su(Hw) insulators (pSIs) that represent regions containing clustered matches to the gypsy insulator Su(Hw) consensus binding sequence. The majority of these pSIs contain fewer than four Su(Hw) binding sites, with only seven showing in vivo Su(Hw) association, as demonstrated by chromatin immunoprecipitation. To understand the properties of the pSIs, these elements were tested for enhancer-blocking capabilities using a transgene assay system. In a complementary set of experiments, effects of the pSIs on transcriptional regulation of genes at the natural genomic location were determined. Our data suggest that pSIs have complex genomic functions and, in some cases, establish insulators. These studies provide the first direct evidence that the Su(Hw) protein contributes to the regulation of gene expression in the Drosophila genome through the establishment of endogenous insulators.
Figures
FIG. 1.
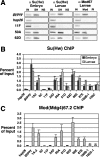
ChIP analysis of pSI-binding sites. (A) Representative examples of PCR products obtained from chromatin material that was directly purified (input [IN]) or immunoprecipitated with Su(Hw) (SH), nonspecific rabbit antibody (NS), Mod(mdg4)67.2 antibody (Mod), or preimmune antibody (PI). PCR products were obtained using primers specific to the gypsy insulator, the hsp26 coding region, and the pSIs 11F, 50A, and 62D. (B and C) The percentage of input was determined by quantifying the intensity of the PCR product in the antibody-enriched fraction relative to the input. Averages of at least three ChIP experiments are shown. Enrichment resulting from the Su(Hw) antibody is shown in panel B, using chromatin isolated from embryos (black bars) and third-instar larvae (gray bars). Enrichment resulting from the Mod(mdg4) antibody is shown in panel C, using chromatin isolated from larvae.
FIG. 2.
Analysis of in vitro Su(Hw) association with pSIs. (A) EMSA results are shown for 32P-labeled probes corresponding to the gypsy insulator and pSIs 11F, 50A, and 61C. Either no Su(Hw) protein (−) or increasing amounts of purified recombinant Su(Hw) protein were combined with labeled probes. The amount of Su(Hw) protein was increased threefold in each lane, beginning at 0.003 μg.
FIG. 3.
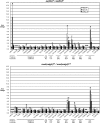
pSIs contribute to regulation of endogenous gene expression. (Top) Results from real-time PCR analysis of RNA y 2 and y2; su(Hw)v /su(Hw)v flies, isolated from larvae and pupae 6 (white bars), 8 (gray bars), and 10 (black bars) days after egg deposition, are shown, using primers to the indicated genes. These values were normalized to levels of Ras2 RNA accumulation, and the change was determined by dividing the value obtained with RNA isolated from su(Hw) mutants by the value from y 2 RNA. A value of 1.0 represents no change in RNA accumulation in the two genetic backgrounds. Solid bars represent the position of a twofold increase or decrease in change of expression. Several genes were analyzed, including two positive controls [genes expected to show different RNA accumulation in the su(Hw) mutant background], eight negative controls [genes expected to show similar levels of RNA accumulation in su(Hw) and y _2_], two nonbinding Su(Hw) pSIs (6C and 11F) and five binding Su(Hw) pSIs (24D, 50A, 62D, 66E, and 87E). (Bottom) Results from real-time PCR analysis of y2 and y2; mod(mdg4)u1 /mod(mdg4)u1 RNA are shown, using the same analysis as described for panel A. Asterisks indicate P values of <0.05.
Similar articles
- Investigation of the properties of non-gypsy suppressor of hairy-wing-binding sites.
Kuhn-Parnell EJ, Helou C, Marion DJ, Gilmore BL, Parnell TJ, Wold MS, Geyer PK. Kuhn-Parnell EJ, et al. Genetics. 2008 Jul;179(3):1263-73. doi: 10.1534/genetics.108.087254. Epub 2008 Jun 18. Genetics. 2008. PMID: 18562648 Free PMC article. - Genomic mapping of Suppressor of Hairy-wing binding sites in Drosophila.
Adryan B, Woerfel G, Birch-Machin I, Gao S, Quick M, Meadows L, Russell S, White R. Adryan B, et al. Genome Biol. 2007;8(8):R167. doi: 10.1186/gb-2007-8-8-r167. Genome Biol. 2007. PMID: 17705839 Free PMC article. - Genomic organization of gypsy chromatin insulators in Drosophila melanogaster.
Ramos E, Ghosh D, Baxter E, Corces VG. Ramos E, et al. Genetics. 2006 Apr;172(4):2337-49. doi: 10.1534/genetics.105.054742. Epub 2006 Feb 1. Genetics. 2006. PMID: 16452134 Free PMC article. - Genetic and molecular analysis of the gypsy chromatin insulator of Drosophila.
Gdula DA, Gerasimova TI, Corces VG. Gdula DA, et al. Proc Natl Acad Sci U S A. 1996 Sep 3;93(18):9378-83. doi: 10.1073/pnas.93.18.9378. Proc Natl Acad Sci U S A. 1996. PMID: 8790337 Free PMC article. Review. - Chromatin insulators: regulatory mechanisms and epigenetic inheritance.
Bushey AM, Dorman ER, Corces VG. Bushey AM, et al. Mol Cell. 2008 Oct 10;32(1):1-9. doi: 10.1016/j.molcel.2008.08.017. Mol Cell. 2008. PMID: 18851828 Free PMC article. Review.
Cited by
- The role of the Suppressor of Hairy-wing insulator protein in Drosophila oogenesis.
Baxley RM, Soshnev AA, Koryakov DE, Zhimulev IF, Geyer PK. Baxley RM, et al. Dev Biol. 2011 Aug 15;356(2):398-410. doi: 10.1016/j.ydbio.2011.05.666. Epub 2011 May 30. Dev Biol. 2011. PMID: 21651900 Free PMC article. - Three subclasses of a Drosophila insulator show distinct and cell type-specific genomic distributions.
Bushey AM, Ramos E, Corces VG. Bushey AM, et al. Genes Dev. 2009 Jun 1;23(11):1338-50. doi: 10.1101/gad.1798209. Epub 2009 May 14. Genes Dev. 2009. PMID: 19443682 Free PMC article. - A stage-specific factor confers Fab-7 boundary activity during early embryogenesis in Drosophila.
Aoki T, Schweinsberg S, Manasson J, Schedl P. Aoki T, et al. Mol Cell Biol. 2008 Feb;28(3):1047-60. doi: 10.1128/MCB.01622-07. Epub 2007 Nov 26. Mol Cell Biol. 2008. PMID: 18039839 Free PMC article. - The Drosophila insulator proteins CTCF and CP190 link enhancer blocking to body patterning.
Mohan M, Bartkuhn M, Herold M, Philippen A, Heinl N, Bardenhagen I, Leers J, White RA, Renkawitz-Pohl R, Saumweber H, Renkawitz R. Mohan M, et al. EMBO J. 2007 Oct 3;26(19):4203-14. doi: 10.1038/sj.emboj.7601851. Epub 2007 Sep 6. EMBO J. 2007. PMID: 17805343 Free PMC article. - A conserved long noncoding RNA affects sleep behavior in Drosophila.
Soshnev AA, Ishimoto H, McAllister BF, Li X, Wehling MD, Kitamoto T, Geyer PK. Soshnev AA, et al. Genetics. 2011 Oct;189(2):455-68. doi: 10.1534/genetics.111.131706. Epub 2011 Jul 20. Genetics. 2011. PMID: 21775470 Free PMC article.
References
- Bell, A. C., A. G. West, and G. Felsenfeld. 1999. The protein CTCF is required for the enhancer blocking activity of vertebrate insulators. Cell 98:387-396. - PubMed
- Berman, B. P., Y. Nibu, B. D. Pfeiffer, P. Tomancak, S. E. Celniker, M. Levine, G. M. Rubin, and M. B. Eisen. 2002. Exploiting transcription factor binding site clustering to identify cis-regulatory modules involved in pattern formation in the Drosophila genome. Proc. Natl. Acad. Sci. USA 99:757-762. - PMC - PubMed
- Berman, B. P., B. D. Pfeiffer, T. R. Laverty, S. L. Salzberg, G. M. Rubin, M. B. Eisen, and S. E. Celniker. 2004. Computational identification of developmental enhancers: conservation and function of transcription factor binding-site clusters in Drosophila melanogaster and Drosophila pseudoobscura. Genome Biol. 5:R61. - PMC - PubMed
- Boutanaev, A. M., A. I. Kalmykova, Y. Y. Shevelyov, and D. I. Nurminsky. 2002. Large clusters of co-expressed genes in the Drosophila genome. Nature 420:666-669. - PubMed
MeSH terms
Substances
LinkOut - more resources
Full Text Sources
Molecular Biology Databases


