Optimization and evaluation of a coarse-grained model of protein motion using x-ray crystal data - PubMed (original) (raw)
Optimization and evaluation of a coarse-grained model of protein motion using x-ray crystal data
Dmitry A Kondrashov et al. Biophys J. 2006.
Abstract
Simple coarse-grained models, such as the Gaussian network model, have been shown to capture some of the features of equilibrium protein dynamics. We extend this model by using atomic contacts to define residue interactions and introducing more than one interaction parameter between residues. We use B-factors from 98 ultra-high resolution (<or=1.0 A) x-ray crystal structures to optimize the interaction parameters. The average correlation between Gaussian network-model fluctuation predictions and the B-factors is 0.64 for the data set, consistent with a previous large-scale study. By separating residue interactions into covalent and noncovalent, we achieve an average correlation of 0.74, and addition of ligands and cofactors further improves the correlation to 0.75. However, further separating the noncovalent interactions into nonpolar, polar, and mixed yields no significant improvement. The addition of simple chemical information results in better prediction quality without increasing the size of the coarse-grained model.
Figures
FIGURE 1
Cartoon of calmodulin structure (1EXR) in green with C_α_ atoms within 7.3 Å connected by magenta dotted lines to represent GNM interactions.
FIGURE 2
Contrast between residue interactions selected by C_α_ distance (magenta) and nearest-atom distance (blue). (A) Residues with a strong ring-stacking interaction with C_α_ distance >7.3 Å. (B) Residues not in chemical contact with C_α_ distance <7 Å. Both examples from sperm whale myoglobin structure (1A6M).
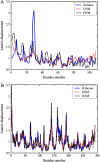
FIGURE 3
Examples of computed fluctuation profiles and experimental B-factors (normalized). (A) Worst prediction, 1J0P (0.46 CNM, 0.46 GNM). (B) Best prediction, 2BW4 (0.9 CNM, GNM 0.84).
FIGURE 4
Comparison of corresponding low-frequency modes from GNM and CNM. The upper curve shows the ratio of the eigenvalues divided by the lowest frequency, averaged over the 98 structures. The lower curve is the average dot product between the corresponding normal modes. Note the fast decline of the normal modes at higher frequencies.
Similar articles
- Comparison of full-atomic and coarse-grained models to examine the molecular fluctuations of c-AMP dependent protein kinase.
Keskin O. Keskin O. J Biomol Struct Dyn. 2002 Dec;20(3):333-45. doi: 10.1080/07391102.2002.10506852. J Biomol Struct Dyn. 2002. PMID: 12437372 - Molecular dynamics simulations of a calmodulin-peptide complex in solution.
Yang C, Kuczera K. Yang C, et al. J Biomol Struct Dyn. 2002 Oct;20(2):179-97. doi: 10.1080/07391102.2002.10506834. J Biomol Struct Dyn. 2002. PMID: 12354070 - Separation of time scale and coupling in the motion governed by the coarse-grained and fine degrees of freedom in a polypeptide backbone.
Murarka RK, Liwo A, Scheraga HA. Murarka RK, et al. J Chem Phys. 2007 Oct 21;127(15):155103. doi: 10.1063/1.2784200. J Chem Phys. 2007. PMID: 17949219 - Development of novel statistical potentials for protein fold recognition.
Buchete NV, Straub JE, Thirumalai D. Buchete NV, et al. Curr Opin Struct Biol. 2004 Apr;14(2):225-32. doi: 10.1016/j.sbi.2004.03.002. Curr Opin Struct Biol. 2004. PMID: 15093838 Review. - Coarse-grained normal mode analysis in structural biology.
Bahar I, Rader AJ. Bahar I, et al. Curr Opin Struct Biol. 2005 Oct;15(5):586-92. doi: 10.1016/j.sbi.2005.08.007. Curr Opin Struct Biol. 2005. PMID: 16143512 Free PMC article. Review.
Cited by
- The effects of rigid motions on elastic network model force constants.
Lezon TR. Lezon TR. Proteins. 2012 Apr;80(4):1133-42. doi: 10.1002/prot.24014. Epub 2012 Jan 7. Proteins. 2012. PMID: 22228562 Free PMC article. - Models with energy penalty on interresidue rotation address insufficiencies of conventional elastic network models.
Yang LW. Yang LW. Biophys J. 2011 Apr 6;100(7):1784-93. doi: 10.1016/j.bpj.2011.02.033. Biophys J. 2011. PMID: 21463592 Free PMC article. - Evaluating elastic network models of crystalline biological molecules with temperature factors, correlated motions, and diffuse x-ray scattering.
Riccardi D, Cui Q, Phillips GN Jr. Riccardi D, et al. Biophys J. 2010 Oct 20;99(8):2616-25. doi: 10.1016/j.bpj.2010.08.013. Biophys J. 2010. PMID: 20959103 Free PMC article. - Computational methods for predicting sites of functionally important dynamics.
Schuyler AD, Carlson HA, Feldman EL. Schuyler AD, et al. J Phys Chem B. 2009 May 14;113(19):6613-22. doi: 10.1021/jp808736c. J Phys Chem B. 2009. PMID: 19378962 Free PMC article. - Structural improvement of unliganded simian immunodeficiency virus gp120 core by normal-mode-based X-ray crystallographic refinement.
Chen X, Lu M, Poon BK, Wang Q, Ma J. Chen X, et al. Acta Crystallogr D Biol Crystallogr. 2009 Apr;65(Pt 4):339-47. doi: 10.1107/S0907444909003539. Epub 2009 Mar 19. Acta Crystallogr D Biol Crystallogr. 2009. PMID: 19307715 Free PMC article.
References
- Schotte, F., M. Lim, T. A. Jackson, A. V. Smirnov, J. Soman, J. S. Olson, G. N. Phillips, Jr., M. Wulff, and P. A. Anfinrud. 2003. Watching a protein as it functions with 150-ps time-resolved x-ray crystallography. Science. 300:1944–1947. - PubMed
- Lindorff-Larsen, K., R. B. Best, M. A. DePristo, C. M. Dobson, and M. Vendruscolo. 2005. Simultaneous determination of protein structure and dynamics. Nature. 433:128–132. - PubMed
- Palmer, A. G., C. D. Kroenke, and J. P. Loria. 2001. Nuclear magnetic resonance methods for quantifying microsecond-to-millisecond motions in biological macromolecules. In Nuclear Magnetic Resonance of Biological Macromolecules, Pt. B, Vol. 339, Methods in Enzymology. Academic Press, San Diego, CA. - PubMed
- Lanman, J., and J. P. E. Prevelige. 2004. High-sensitivity mass spectrometry for imaging subunit interactions: hydrogen/deuterium exchange. Curr. Opin. Struct. Biol. 14:181–188. - PubMed
Publication types
MeSH terms
Substances
LinkOut - more resources
Full Text Sources
Other Literature Sources


