UniFrac--an online tool for comparing microbial community diversity in a phylogenetic context - PubMed (original) (raw)
Comparative Study
UniFrac--an online tool for comparing microbial community diversity in a phylogenetic context
Catherine Lozupone et al. BMC Bioinformatics. 2006.
Abstract
Background: Moving beyond pairwise significance tests to compare many microbial communities simultaneously is critical for understanding large-scale trends in microbial ecology and community assembly. Techniques that allow microbial communities to be compared in a phylogenetic context are rapidly gaining acceptance, but the widespread application of these techniques has been hindered by the difficulty of performing the analyses.
Results: We introduce UniFrac, a web application available at http://bmf.colorado.edu/unifrac, that allows several phylogenetic tests for differences among communities to be easily applied and interpreted. We demonstrate the use of UniFrac to cluster multiple environments, and to test which environments are significantly different. We show that analysis of previously published sequences from the Columbia river, its estuary, and the adjacent coastal ocean using the UniFrac interface provided insights that were not apparent from the initial data analysis, which used other commonly employed techniques to compare the communities.
Conclusion: UniFrac provides easy access to powerful multivariate techniques for comparing microbial communities in a phylogenetic context. We thus expect that it will provide a completely new picture of many microbial interactions and processes in both environmental and medical contexts.
Figures
Figure 1
Select analysis page that is displayed after loading a tree and environment file. Only part of the screen is shown with a text representation of the tree. Each branch is labeled with the sequence name in black, the environment in which the sequence was found in blue, and the number of times that it was observed in red. The options for the Lineage-Specific Analysis are displayed. The dotted red bar is used to cut the tree into lineages.
Figure 2
Screenshots of analysis results. For the environment names, the letter before the underscore indicates whether the sequences were from the Columbia River (R), its estuary (E), or the adjacent coastal Ocean (O). The letters after the underscore indicate whether the sequences were from the particle-attached (PA), free-living (FL) bacteria or from unfiltered water (UN). A) Result of running the Environment Counts Analysis option with Use abundance weights set to No, so that the counts represent the number of OTUs rather than the total number of clones evaluated (which would sum to 236 instead of 163). B) Result of running Environment Distance Matrix. The values are colored by quartile; values in the 0–25% range are red, 25–50% are yellow, 50–75% are green, and 75–100% are blue.
Figure 3
Comparison of the UniFrac Significance test and the P-test with raw and de-replicated data. This figure illustrates how the same tree can have a significant P-test _P_-value and a non-significant UniFrac significance test _P_-value. The trees drawn in A and B have the same topology but different branch lengths. The boxes and triangles represent sequences from two different environments. The trees on the left are being evaluated to determine whether the square and triangle communities are significantly different. The trees on the right are example trees in which the environment assignments have been randomized. The parsimony changes that are calculated with the P-test are represented by red dots. The color of the branches represent calculations made for the UniFrac significance test; branches that lead to only one of the two environments are black and branches that lead to descendants of both environments are grey. A.) A tree that would have a significant P-test result and a non-significant UniFrac Significance test result. The sequences from the square and triangle environments are clustered together on the tree, and it thus only takes 2 changes between environments to explain their distribution. This is less than would be expected if the sequences were randomly distributed between environments as shown on the right, and thus the _P_-value is likely to be significant (note that in practice, the true tree is compared to many randomized trees and not just one). The monophyletic lineages occur near the tips of the tree, however, and are not associated with a significant amount of unique branch length (black branches). The UniFrac metric value would thus be low and randomization of the tree could easily result in more unique (black) branch length as shown on right, resulting in a non-significant _P_-value. B.) A tree that would have a significant result for both the P-test and the UniFrac significance test. The P-test results are the same as for the tree in A because the topology is the same. However, because the monophyletic lineages in the square and triangle environment represent a substantial amount of branch length in the tree, the UniFrac value is high. The permutations of environment assignments would thus typically result in less unique branch length, leading to a significant result. C) The same analysis as B except that the diversity at the tips of the tree has been removed by choosing OTUs. The UniFrac distance is essentially unchanged, but randomization over the reduced number of taxa results in non-significant _P_-values for both the UniFrac Significance test and the P-test.
Figure 4
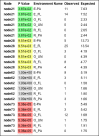
Partial output of the Lineage-Specific Analysis with Minimum descendants set to 6. The complete output consists of both a table and a tree. The table has a row for each environment in each evaluated lineage/node. The nodes are named arbitrarily but can be viewed in the tree. Each evaluated node is colored based on its _P_-value in both the table and the tree. _P_-values < 0.001 are red, < .01 are yellow, < 0.05 are green, < .1 are blue and > 0.1 are gray. The table shows the observed and expected sequence counts for each environment for each evaluated node. The expected counts are what would be expected if the sequences were evenly distributed in the different lineages.
Figure 5
Result of running Jackknife Environment Clusters with Number of sequences to keep set to 12 and Number of Permutations set to 100. The environment abbreviations are the same as described for Fig. 2. Each node is colored by the fraction of times it was recovered in the jackknife replicates. Nodes recovered >99.9% of the time are red, 90–99.9% are yellow, 70–90% are green, 50–70% are blue, and < 50% are grey. The fraction can also be viewed in the interface by moving the pointer over the colored bar.
Figure 6
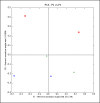
Result of running PCA and choosing to output a ScatterPlot and the Bin envs by:first letter option. Blue squares represent the estuary, green triangles represent the river, and red circles represent the ocean. All points on the left side of the x-axis represent particle-associated bacteria (estuary and river) or bacteria in unfiltered water (ocean). All points on the right side of the x axis are from free-living bacterial communities. The full environment name can be seen by by moving the pointer over the symbols. The axes are labeled with the percent of the variation explained by each principal component.
Figure 7
Screenshots of selected significance test results. Environment abbreviations are the same as described for Fig. 2. A) Result of running P-Test Significance with the Each pair of environments option. The _P_-values have been colored by significance. _P_-values < 0.001 are red, 0.001–0.01 are yellow, 0.01–0.05 are green and 0.05–0.1 are blue and >0.1 are grey. B) Result of running UniFrac Significance on Each environment individually with Number of Permutations set to 1000.
References
- Sakamoto M, Umeda M, Ishikawa I, Benno Y. Comparison of the oral bacterial flora in saliva from a healthy subject and two periodontitis patients by sequence analysis of 16S rDNA libraries. Microbiol Immunol. 2000;44:643–652. - PubMed
Publication types
MeSH terms
Substances
Grants and funding
- T32 GM008759/GM/NIGMS NIH HHS/United States
- T32 GM065103/GM/NIGMS NIH HHS/United States
- T32 GM142607/GM/NIGMS NIH HHS/United States
- T32 GM08759/GM/NIGMS NIH HHS/United States


