Low-grade chronic inflammation in regions of the normal mouse arterial intima predisposed to atherosclerosis - PubMed (original) (raw)
Low-grade chronic inflammation in regions of the normal mouse arterial intima predisposed to atherosclerosis
Jenny Jongstra-Bilen et al. J Exp Med. 2006.
Abstract
Atherosclerotic lesions develop in regions of arterial curvature and branch points, which are exposed to disturbed blood flow and have unique gene expression patterns. The cellular and molecular basis for atherosclerosis susceptibility in these regions is not completely understood. In the intima of atherosclerosis-predisposed regions of the wild-type C57BL/6 mouse aorta, we quantified increased expression of several proinflammatory genes that have been implicated in atherogenesis, including vascular cell adhesion molecule-1 (VCAM-1) and a relative abundance of dendritic cells, but only occasional T cells. In contrast, very few intimal leukocytes were detected in regions resistant to atherosclerosis; however, abundant macrophages, including T cells, were found throughout the adventitia (Adv). Considerably lower numbers of intimal CD68+ leukocytes were found in inbred atherosclerosis-resistant C3H and BALB/c mouse strains relative to C57BL/6 and 129; however, leukocyte distribution throughout the Adv of all strains was similar. The predominant mechanism for the accumulation of intimal CD68+ cells was continued recruitment of bone marrow-derived blood monocytes, suggestive of low-grade chronic inflammation. Local proliferation of intimal leukocytes was low. Intimal CD68+ leukocytes were reduced in VCAM-1-deficient mice, suggesting that mechanisms of leukocyte accumulation in the intima of normal aorta are analogous to those in atherosclerosis.
Figures
Figure 1.
Comparison of intimal cell gene expression in regions of the normal C57BL/6 mouse ascending aorta with different susceptibility to atherosclerosis. Real-time PCR was used to determine the mRNA levels of proinflammatory (A) and cell marker (B) genes. Expression levels for each gene were normalized to CD31, and GC values were compared with the respective LC values (see Supplemental materials and methods). The mean ± SEM of eight independent experiments is plotted. ***, P < 0.001; **, P < 0.01; and *, P < 0.05, indicating significant differences between LC and GC values for each gene using the unpaired t test.
Figure 2.
The distribution and abundance of leukocytes in regions of the normal mouse aorta with different susceptibilities to atherosclerosis. (A) Shown are representative immunoconfocal images of the intima in the LC and GC of the ascending aorta, the Adv in these regions, and the IAO in the DT. Segments of aorta were stained with antibodies directed to CD68, macrophages (RAM) or CD3 (green), and nuclei were counterstained with PI (red). At a minimum, four experiments were performed with each antibody. Bars, 50 μm. (B) The relative densities of RAM+ cells in the LC, GC, DT, and abdominal (Abd) aorta are shown. Means ± SEM of four experiments were normalized to LC values, which are represented as 100. (C) Total number of CD3+ T cells found in the LC and GC of the ascending aorta. Means ± SEM of four experiments are plotted. *, P < 0.001, indicating significant differences from the LC value using the unpaired t test.
Figure 3.
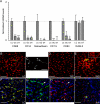
Expression of macrophage and dendritic cell marker genes in the aortic intima. (A) Relative gene expression levels determined by real-time PCR were derived from three or four independent experiments, as described in Fig. 1 for the LC, GC, and DT. The dashed line represents the normalized LC value of 1. Means ± SEM are shown. *, P < 0.05; and **, P < 0.01, indicating significant differences from LC values using one-way ANOVA (except for CD11c, which used the unpaired t test). U, undetectable mRNA levels. Note that similar values were obtained when a different normalizer gene than CD31, HPRT (reference 44) was used (Fig. S3). (B–E) Representative en face immunoconfocal microscopy images from three independent experiments show CD11c expression (green) and nuclei (red) in intimal cells. The same LC region is shown in B and C, with only the fluorescein channel shown in C. Arrowheads indicate cell bodies. The GC and IAO are shown in D and E, respectively. (E, inset) Staining with nonimmune hamster IgG (negative control) is shown. (F) A representative immunoconfocal microscopy image from two independent experiments shows intimal cells in the LC region coexpressing CD68 (red, Cy3) and CD11c (green, fluorescein). The fluorescein (G) and Cy3 (H) channels corresponding to the image in F are shown independently, and cell bodies and processes that show more intense staining for CD11c (arrows) and CD68 (arrowheads) are indicated. (I) A representative image of the Adv shows predominance of CD68 staining and costaining for CD68 and CD11c in only occasional cells. Bars, 50 μm.
Figure 4.
Expression of CD68, CD3, and ICAM-2 by intimal cells isolated from the GC and LC regions of the ascending aorta from different strains of mice. Real-time PCR was used as described in Fig. 1. The GC/LC ratios obtained in different strains were compared. The dashed line represents the normalized LC value of 1. Means ± SEM are plotted for three or four experiments (C57BL/6, 129, and C3H strains) or eight experiments (BALB/c strains). *, P < 0.01; and **, P < 0.001, indicating significant differences from the C57BL/6 strain using one-way ANOVA.
Figure 5.
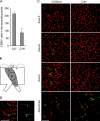
Immunoconfocal assessment of the abundance and distribution of intimal CD68+ cells in the ascending aorta of normal C57BL/6 and C3H mice. (A) The number of intimal CD68+ cells in the LC of C57BL/6 (C57) and C3H mice is plotted. Means ± SEM for four experiments are shown. *, P < 0.001 using the unpaired t test. CD68+ cells were detected very infrequently in the GC of both strains. (B) A schematic diagram of the en face ascending aorta indicating areas A, B, and C of the LC (shaded area). The coronary sinus (CS) and three valve leaflets are indicated. (C) Representative images of C57BL/6 and C3H mice aortae examine the abundance of CD68+ cells (green) and nuclei (red) in areas A–C of the LC intima and Adv. (D) Prominent CD68+ dendritic-like processes are evident in a high magnification view of a C3H LC intima (left, green; right, fluorescein channel only). Bars, 50 μm.
Figure 6.
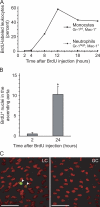
Analysis of BrdU+ leukocytes in blood and the ascending aorta of C57BL/6 mice. (A) Blood leukocytes stained with anti-BrdU, anti-CD11b, and anti–Gr-1 were analyzed by flow cytometry for the presence of BrdU+ monocytes and neutrophils at different times after injection of BrdU. (B) The number of BrdU+ nuclei in the intimal layer of the LC at 2 and 24 h after BrdU injection was determined by immunoconfocal microscopy. Each bar represents the mean ± SEM of four experiments. *, P < 0.05, using the unpaired t test. (C) Representative en face immunoconfocal images of the intima 24 h after BrdU injection demonstrate BrdU+ nuclei (arrowheads) in the LC (left) but not the GC (right). Bars, 50 μm.
Figure 7.
Immunoconfocal assessment of the abundance and distribution of intimal CD68+ cells in the ascending aorta of WT and Vcam1_D4D/D4D_ (D4D) mice. (A) The numbers of intimal CD68+ cells in the LC are plotted. Means ± SEM for four pairs of WT and D4D littermates are shown. *, P < 0.01, using the paired two-tailed t test. (B–E) Representative en face immunoconfocal images of the intima (B and C) and corresponding Adv (D and E) in the LC in WT (B and D) and D4D (C and E) mice. All images are at the same magnification. Bar, 50 μm.
Similar articles
- Nogo-B expression, in arterial intima, is impeded in the early stages of atherosclerosis in humans.
Drożdż K, Grzegorek I, Chmielewska M, Gomułkiewicz A, Jabłońska K, Piotrowska A, Karczewski M, Janczak D, Patrzałek D, Dzięgiel P, Szuba A. Drożdż K, et al. APMIS. 2014 Sep;122(9):742-9. doi: 10.1111/apm.12212. Epub 2013 Dec 23. APMIS. 2014. PMID: 24372562 - Resident intimal dendritic cells and the initiation of atherosclerosis.
Cybulsky MI, Jongstra-Bilen J. Cybulsky MI, et al. Curr Opin Lipidol. 2010 Oct;21(5):397-403. doi: 10.1097/MOL.0b013e32833ded96. Curr Opin Lipidol. 2010. PMID: 20720490 Review. - Resident intimal dendritic cells accumulate lipid and contribute to the initiation of atherosclerosis.
Paulson KE, Zhu SN, Chen M, Nurmohamed S, Jongstra-Bilen J, Cybulsky MI. Paulson KE, et al. Circ Res. 2010 Feb 5;106(2):383-90. doi: 10.1161/CIRCRESAHA.109.210781. Epub 2009 Nov 5. Circ Res. 2010. PMID: 19893012 - Haemodynamic stress-induced breaches of the arterial intima trigger inflammation and drive atherogenesis.
Franck G, Even G, Gautier A, Salinas M, Loste A, Procopio E, Gaston AT, Morvan M, Dupont S, Deschildre C, Berissi S, Laschet J, Nataf P, Nicoletti A, Michel JB, Caligiuri G. Franck G, et al. Eur Heart J. 2019 Mar 14;40(11):928-937. doi: 10.1093/eurheartj/ehy822. Eur Heart J. 2019. PMID: 30541066 - Atherosclerosis and inflammation mononuclear cell recruitment and adhesion molecules with reference to the implication of ICAM-1/LFA-1 pathway in atherogenesis.
Watanabe T, Fan J. Watanabe T, et al. Int J Cardiol. 1998 Oct 1;66 Suppl 1:S45-53; discussion S55. doi: 10.1016/s0167-5273(98)00147-8. Int J Cardiol. 1998. PMID: 9951802 Review.
Cited by
- Dendritic cells and regulatory T cells in atherosclerosis.
Cheong C, Choi JH. Cheong C, et al. Mol Cells. 2012 Oct;34(4):341-7. doi: 10.1007/s10059-012-0128-9. Epub 2012 Jun 28. Mol Cells. 2012. PMID: 22752759 Free PMC article. Review. - Cells of the synovium in rheumatoid arthritis. Dendritic cells.
Lutzky V, Hannawi S, Thomas R. Lutzky V, et al. Arthritis Res Ther. 2007;9(4):219. doi: 10.1186/ar2200. Arthritis Res Ther. 2007. PMID: 17850683 Free PMC article. Review. - HIV protein Nef causes dyslipidemia and formation of foam cells in mouse models of atherosclerosis.
Cui HL, Ditiatkovski M, Kesani R, Bobryshev YV, Liu Y, Geyer M, Mukhamedova N, Bukrinsky M, Sviridov D. Cui HL, et al. FASEB J. 2014 Jul;28(7):2828-39. doi: 10.1096/fj.13-246876. Epub 2014 Mar 18. FASEB J. 2014. PMID: 24642731 Free PMC article. - Electronic health record-based genome-wide meta-analysis provides insights on the genetic architecture of non-alcoholic fatty liver disease.
Ghodsian N, Abner E, Emdin CA, Gobeil É, Taba N, Haas ME, Perrot N, Manikpurage HD, Gagnon É, Bourgault J, St-Amand A, Couture C, Mitchell PL, Bossé Y, Mathieu P, Vohl MC, Tchernof A, Thériault S, Khera AV, Esko T, Arsenault BJ. Ghodsian N, et al. Cell Rep Med. 2021 Nov 3;2(11):100437. doi: 10.1016/j.xcrm.2021.100437. eCollection 2021 Nov 16. Cell Rep Med. 2021. PMID: 34841290 Free PMC article. - Interferon Regulatory Factor 5 Controls Necrotic Core Formation in Atherosclerotic Lesions by Impairing Efferocytosis.
Seneviratne AN, Edsfeldt A, Cole JE, Kassiteridi C, Swart M, Park I, Green P, Khoyratty T, Saliba D, Goddard ME, Sansom SN, Goncalves I, Krams R, Udalova IA, Monaco C. Seneviratne AN, et al. Circulation. 2017 Sep 19;136(12):1140-1154. doi: 10.1161/CIRCULATIONAHA.117.027844. Epub 2017 Jul 11. Circulation. 2017. PMID: 28698173 Free PMC article.
References
- Brooks, A.R., P.I. Lelkes, and G.M. Rubanyi. 2002. Gene expression profiling of human aortic endothelial cells exposed to disturbed flow and steady laminar flow. Physiol. Genomics. 9:27–41. - PubMed
- Gimbrone, M.A., Jr., T. Nagel, and J.N. Topper. 1997. Biomechanical activation: an emerging paradigm in endothelial adhesion biology. J. Clin. Invest. 100:S61–S65. - PubMed
- Iiyama, K., L. Hajra, M. Iiyama, H. Li, M. DiChiara, B.D. Medoff, and M.I. Cybulsky. 1999. Patterns of vascular cell adhesion molecule-1 and intercellular adhesion molecule-1 expression in rabbit and mouse atherosclerotic lesions and at sites predisposed to lesion formation. Circ. Res. 85:199–207. - PubMed
Publication types
MeSH terms
Substances
LinkOut - more resources
Full Text Sources
Other Literature Sources
Medical
Molecular Biology Databases
Miscellaneous


