Visualizing polynucleotide polymerase machines at work - PubMed (original) (raw)
Review
Visualizing polynucleotide polymerase machines at work
Thomas A Steitz. EMBO J. 2006.
Abstract
The structures of T7 RNA polymerase (T7 RNAP) captured in the initiation and elongation phases of transcription, that of phi29 DNA polymerase bound to a primer protein and those of the multisubunit RNAPs bound to initiating factors provide insights into how these proteins can initiate RNA synthesis and synthesize 6-10 nucleotides while remaining bound to the site of initiation. Structural insight into the translocation of the product transcript and the separation of the downstream duplex DNA is provided by the structures of the four states of nucleotide incorporation. Single molecule and biochemical studies show a distribution of primer terminus positions that is altered by the binding of NTP and PP(i) ligands. This article reviews the insights that imaging the structure of polynucleotide polymerases at different steps of the polymerization reaction has provided on the mechanisms of the polymerization reaction. Movies are shown that allow the direct visualization of the conformational changes that the polymerases undergo during the different steps of polymerization.
Figures
Figure 1
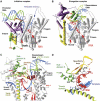
(A–D) Comparison of the structures of the T7 RNAP initiation and elongation complexes (A, B) and views of the transcription bubble (C, D) (Yin and Steitz, 2002). The initiation complex (A) and elongation complex (B) have been orientated equivalently by superimposing their palm domains. Helices are represented by cylinders and beta strands by arrows. The corresponding residues in the NH2-terminal domains of the two complexes that undergo major refolding are colored in yellow, green and purple, and the COOH-terminal domain (residues 300–883) is colored in gray. The template DNA (blue), non-template DNA (green) and RNA (red) are represented with ribbon backbones. The proteolysis-susceptible region (residues 170–180) is a part of subdomain H (green) in the elongation complex and has moved more than 70 Å from its location in the initiation complex. The specificity loop (brown) recognizes the promoter during initiation and contacts the 5′ end of RNA during elongation, whereas the intercalating hairpin (purple) opens the upstream end of the bubble in the initiation phase and is not involved in elongation. The large conformational change in the NH2-terminal region of T7 RNAP facilitates promoter clearance. This figure was made with the program Ribbons. (C) Interactions of the transcription bubble and heteroduplex in the elongation complex with domain H (green and red) and specificity loop (brown). Proteolytic cuts within the red loop in subdomain H reduce elongation synthesis (Ikeda and Richardson, 1987; Muller et al, 1988). Thumb sigma helix (yellow) and sigma helix Y (orange) are analogously involved in strand separation. (D) Side chains from subdomain H (green), the specificity loop (brown) and the thumb that interact with the single-stranded 5′ end of the RNA transcript and facilitate its separation from the template.
Figure 2
(A, B) The priming domain of terminal protein binds polymerase in the same location that the primer–template DNA binds to polymerase (Kamtekar et al, 2006). (A) A space filling representation of polymerase with a cylinder representation of terminal protein. (B) The primer–template DNA from the structure of an RB69 DNAP ternary complex (Franklin et al, 2001) homology modeled onto the structure of φ29 DNAP. The binding site of the priming domain overlaps that of the DNA.
Figure 3
A model for the transition from initiation of replication to elongation (Kamtekar et al, 2006). A space filling representation of the polymerase has been cut through the polymerase to expose the DNA and primer binding cleft. (A) Modeled primer (green) and template (orange) in an elongating complex are represented as sticks. The positions of a phosphate being incorporated, as well as its positions after two, five and eight cycles of incorporation are indicated as red spheres, illustrating the spiral translocation of synthesized DNA. (B) A model for the covalent addition of the first nucleotide onto S232 of terminal protein. Terminal protein is colored by domain, with a plausible path for the loop containing S232 shown in red (this loop is disordered in the current structure). (C) Following the hinge motion indicated in panel B, the interactions between the intermediate domain and polymerase can be maintained. The priming domain has backed away from the polymerase active site enough to allow the incorporation of two more nucleotides. (D) A further hinge motion between the priming domain and the intermediate domain is consistent with the incorporation of 5 nucleotides. (E) A hinge motion alone is insufficient after the incorporation of seven bases. The example shown here is for nucleotide eight; the distance between the α phosphate and the hinge is only 26 Å, which is shorter than the length of the priming domain (approximately 40 Å), suggesting that the intermediate domain must be displaced resulting in the dissociation of polymerase–terminal protein complex.
Figure 4
Structural changes at the active site during a single nucleotide addition cycle (Yin and Steitz, 2004). This figure shows the O helix with its phosphate binding K631 and R627, a β turn–β motif bearing the metal binding catalytic D812 and D537, template nucleotides in blue, the RNA primer terminus in green, as well as the P and N sites in green and pink ovals. (A) The NTP (red) is bound to the N site in position to be inserted with its metal-bound triphosphate moiety crosslinking the O helix to the active site aspartic acid residues. Template nucleotide i+1 (light blue) forms a base pair with the correct incoming nucleotide. (B) The product of the phosphoryl transfer reaction shows a Mg ion (blue) bound to PPi (red), which crosslinks D531 to R677, thereby maintaining RNAP in an identical conformation as in the substrate complex. The 3′ end of RNA remains in the N site in a pre-translocation state. (C) Release of Mg-PPi results in the loss of the link between the O helix and D531, which promotes the rotation of the O helix and translocation of the 3′ end of the RNA to the P site. The RNAP conformational change also places Y639 into the N site and positions the i+2 template nucleotide into the flipped-out, pre-insertion position. (D) A modeled NTP pre-insertion complex with NTP bound to the post-translocated RNAP. Although the base binding site is blocked by the side chain of Y639, the triphosphate binding site on the O helix is accessible.
Figure 5
A superposition of the pre- and post-translocation structures at the active site showing the pivoted rotation undergone by the O helix that is associated with translocation (Yin and Steitz, 2004). In the pre-translocation complex (lighter colors), the O helix (light gray) is positioned in the closed conformation by PPi (light red), which is bound to the catalytic carboxyls through Mg. In this conformation, Y639 allows formation of the new base pair (light red and blue). After PPi release, the O helix rotates around Val634, which results in the positive end of the helix moving away from the active site, whereas the other end of the helix moves Y639 by 3.4 Å into the position of the newly formed primer terminus, resulting in translocation.
Figure 6
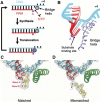
(A, B) Proposed transcription cycle and translocation mechanism (Gnatt et al, 2001). (A) Schematic representation of the nucleotide addition cycle. The NTP fills the open substrate site (top) and forms a phosphodiester bond at the active site (‘Synthesis'). This results in the state of the transcribing complex seen in the crystal structure (middle). Gnatt et al (2001) speculate that ‘Translocation' of the nucleic acids with respect to the active site (marked by a pink dot for metal A) involves a change of the bridge helix from a straight (silver circle) to a bent conformation (violet circle, bottom). Relaxation of the bridge helix back to a straight conformation without movement of the nucleic acids would result in an open substrate site 1 nucleotide downstream and would complete the cycle. (B) Different conformations of the bridge helix in Pol II and bacterial RNAP structures. The bacterial RNAP structure (Zhang et al, 1999) was superimposed on the Pol II transcribing complex by fitting residues around the active site. The resulting fit of the bridge helices of Pol II (silver) and the bacterial polymerase (violet) is shown. The bend in the bridge helix in the bacterial polymerase structure causes a clash of amino-acid side chains (extending from the backbone shown here) with the hybrid base pair at position +1. (C, D) Downstream end of the DNA–RNA hybrid in transcribing complex structures, showing occupancy of the A and E sites (Westover et al, 2004b). (C) Transcribing complex with matched NTP (UTP) in the A site. (D) Transcribing complex with mismatched NTP (ATP) in the E site. DNA is blue, RNA is red and NTPs are in yellow. Mg ions are shown as magenta spheres.
Similar articles
- The structural changes of T7 RNA polymerase from transcription initiation to elongation.
Steitz TA. Steitz TA. Curr Opin Struct Biol. 2009 Dec;19(6):683-90. doi: 10.1016/j.sbi.2009.09.001. Epub 2009 Oct 5. Curr Opin Struct Biol. 2009. PMID: 19811903 Free PMC article. Review. - A small post-translocation energy bias aids nucleotide selection in T7 RNA polymerase transcription.
Yu J, Oster G. Yu J, et al. Biophys J. 2012 Feb 8;102(3):532-41. doi: 10.1016/j.bpj.2011.12.028. Epub 2012 Feb 7. Biophys J. 2012. PMID: 22325276 Free PMC article. - The structure of a transcribing T7 RNA polymerase in transition from initiation to elongation.
Durniak KJ, Bailey S, Steitz TA. Durniak KJ, et al. Science. 2008 Oct 24;322(5901):553-7. doi: 10.1126/science.1163433. Science. 2008. PMID: 18948533 Free PMC article. - Effects of substitutions in a conserved DX(2)GR sequence motif, found in many DNA-dependent nucleotide polymerases, on transcription by T7 RNA polymerase.
Imburgio D, Anikin M, McAllister WT. Imburgio D, et al. J Mol Biol. 2002 May 24;319(1):37-51. doi: 10.1016/S0022-2836(02)00261-9. J Mol Biol. 2002. PMID: 12051935
Cited by
- A proposal: Evolution of PCNA's role as a marker of newly replicated DNA.
Georgescu R, Langston L, O'Donnell M. Georgescu R, et al. DNA Repair (Amst). 2015 May;29:4-15. doi: 10.1016/j.dnarep.2015.01.015. Epub 2015 Feb 9. DNA Repair (Amst). 2015. PMID: 25704660 Free PMC article. Review. - Picornaviral polymerase domain exchanges reveal a modular basis for distinct biochemical activities of viral RNA-dependent RNA polymerases.
Watkins CL, Kempf BJ, Beaucourt S, Barton DJ, Peersen OB. Watkins CL, et al. J Biol Chem. 2020 Jul 31;295(31):10624-10637. doi: 10.1074/jbc.RA120.013906. Epub 2020 Jun 3. J Biol Chem. 2020. PMID: 32493771 Free PMC article. - An artificial processivity clamp made with streptavidin facilitates oriented attachment of polymerase-DNA complexes to surfaces.
Williams JG, Steffens DL, Anderson JP, Urlacher TM, Lamb DT, Grone DL, Egelhoff JC. Williams JG, et al. Nucleic Acids Res. 2008 Oct;36(18):e121. doi: 10.1093/nar/gkn531. Epub 2008 Aug 22. Nucleic Acids Res. 2008. PMID: 18723573 Free PMC article. - Chaperones activate hepadnavirus reverse transcriptase by transiently exposing a C-proximal region in the terminal protein domain that contributes to epsilon RNA binding.
Stahl M, Beck J, Nassal M. Stahl M, et al. J Virol. 2007 Dec;81(24):13354-64. doi: 10.1128/JVI.01196-07. Epub 2007 Oct 3. J Virol. 2007. PMID: 17913810 Free PMC article. - The ins and outs of four-tunneled Reoviridae RNA-dependent RNA polymerases.
McDonald SM, Tao YJ, Patton JT. McDonald SM, et al. Curr Opin Struct Biol. 2009 Dec;19(6):775-82. doi: 10.1016/j.sbi.2009.10.007. Epub 2009 Nov 14. Curr Opin Struct Biol. 2009. PMID: 19914820 Free PMC article. Review.
References
- Bushnell DA, Westover KD, Davis RE, Kornberg RD (2004) Structural basis of transcription and RNA polymerase II–TFIIB cocrystal at 4.5 Å. Science 303: 983–988 - PubMed
- Cheetham GMT, Jeruzalmi D, Steitz TA (1999) Structural basis for initiation of transcription from an RNA polymerase–promoter complex. Nature 399: 80–83 - PubMed
- Cheetham GMT, Steitz TA (1999) Structure of a transcribing T7 RNA polymerase initiation complex. Science 286: 2305–2309 - PubMed
- Chen HT, Hahn S (2004) Mapping the location of TFIIB within the Rna polymerase II transcription preinitiation complex: a model for the structure of the PIC. Cell 119: 169–180 - PubMed
Publication types
MeSH terms
Substances
LinkOut - more resources
Full Text Sources
Other Literature Sources
Miscellaneous


