RNA polymerase II elongation factors Spt4p and Spt5p play roles in transcription elongation by RNA polymerase I and rRNA processing - PubMed (original) (raw)
RNA polymerase II elongation factors Spt4p and Spt5p play roles in transcription elongation by RNA polymerase I and rRNA processing
D A Schneider et al. Proc Natl Acad Sci U S A. 2006.
Abstract
Previous investigations into the mechanisms that control RNA Polymerase (Pol) I transcription have primarily focused on the process of transcription initiation, thus little is known regarding postinitiation steps in the transcription cycle. Spt4p and Spt5p are conserved throughout eukaryotes, and they affect elongation by Pol II. We have found that these two proteins copurify with Pol I and associate with the rDNA in vivo. Disruption of the gene for Spt4p resulted in a modest decrease in growth and rRNA synthesis rates at the permissive temperature, 30 degrees C. Furthermore, biochemical and EM analyses showed clear defects in rRNA processing. These data suggest that Spt4p, Spt5p, and, potentially, other regulators of Pol I transcription elongation play important roles in coupling rRNA transcription to its processing and ribosome assembly.
Conflict of interest statement
Conflict of interest statement: No conflicts declared.
Figures
Fig. 1.
Spt4/5 associates with Pol I. Pol I was immunoprecipitated from equivalent amounts of crude extracts made from NOY761 (HA-Rrn3p) and NOY2164 (HA-Spt5p) by using a polyclonal antibody against A190. For control, identical extracts were treated with protein A-Sepharose beads only. Coprecipitated HA-tagged Rrn3p and Spt5p were detected by Western blot using the monoclonal antibody 12CA5.
Fig. 2.
Spt4p and Spt5p associate with rDNA in vivo. ChIP analysis of (His)7-(HA)3-tagged Spt4p, Spt5p, and A135 (Pol I) was performed by using strains NOY2165, NOY2164, and NOY2166, respectively. NOY388 was also analyzed as “no tag” control. Anti-HA antibody 12CA5 was used for IP, and two dilutions of both input and IP DNA were analyzed by PCR to verify that the data were in the linear range of detection. Two regions of the rDNA were examined: the promoter region from −251 to −24 and the 25S coding region from +3586 to +3876. Numbering is relative to the initiation site of Pol I. ChIP data from three independent cultures were quantified by using a PhosporImager, and the ratios of IP/input were averaged for each region of the rDNA and were normalized to the values for Pol I.
Fig. 3.
Processivity analysis of Pol I transcription in the _spt4_Δ strain relative to WT. NOY388 (WT) and NOY2167 (_spt4_Δ) (both carrying pRS316) were grown to A600 = ≈0.3 in SD-Ura medium. (A) Pol I association with the 5′ end (+67 to +388) and the 3′ end (+6067 to +6388) of the 35S rRNA coding region was then measured by ChIP using anti-A190 antibodies. Two dilutions of input and IP DNA were measured by PCR. As a negative control, duplicate samples were treated with protein A-Sepharose beads only (“−Ab”) and diluted similarly to IP samples. (B) For each strain, the IP/input value for the 3′ end was divided by the value for the 5′ end, and the ratio (“processivity”) for the mutant was normalized to that for WT. The values obtained from four independent IPs from two independent cultures were averaged. Raw values for IP/input were 0.060 ± 0.014 for the 5′ end of WT, 0.013 ± 0.002 for the 3′ end of WT, 0.124 ± 0.004 for the 5′ end of _spt4_Δ, and 0.017 ± 0.003 for the 3′ end of _spt4_Δ.
Fig. 4.
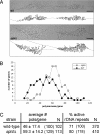
Representative EMs of rRNA genes from the _spt4_Δ strain relative to WT. (A) NOY388 (WT) and NOY2167 (_spt4_Δ) were grown in YEPD plus 1 M sorbitol to midlog phase. Miller spreads were analyzed by EM, and two active genes are shown for each strain. (Scale bars, 0.5 μm.) (B) The number of Pol I molecules per gene was counted, and distribution of Pol I among genes is plotted by grouping with an increment of 5. (C) Numerical values for the data presented in B and the active rDNA repeats (as percentage of total) counted for contiguously traced rDNA regions (23) are shown. The values for the mutant normalized to those for the WT (100) are also shown in parentheses. N, the number of genes examined per strain; pols, polymerases.
Fig. 5.
rDNA copy number is reduced in the _spt4_Δ strain compared with WT. (A) genomic DNA was extracted from three independent isolates of _spt4_Δ (NOY2167) and three independent WT cultures (NOY388) as well as from cultures with known rDNA copy numbers: NOY1071 (25 copies), NOY886 (42 copies), and NOY1064 (143 copies). After digestion with HindIII, DNA was separated in a 1.5% agarose gel and transferred to a nylon membrane. Southern hybridization was performed using 32P-labeled DNA probes against rDNA and the single copy control gene URA3. To visualize the URA3 probe clearly (Lower), exposure time was extended. (B) Data from A were quantified by using a PhosphorImager, and the ratio of rDNA/URA3 of the reference strains was plotted against copy number. From the resulting linear regression, the average copy number in WT and _spt4_Δ was calculated. Variations (standard deviations) among three independent cultures were ≈15% for both WT and _spt4_Δ.
Fig. 6.
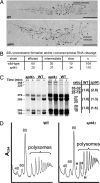
Processing of rRNA transcripts is impaired in the spt4_Δ strain. (A) One of the two genes shown in Fig. 4_A for NOY388 (WT) and for NOY2167 (_spt4_Δ) is shown in higher magnification with notes indicating the absence of cotranscriptional cleavage of the 35S rRNA in the gene from the _spt4_Δ strain. (Scale bars, 0.5 μm.) (B) Quantification of SSU processome formation and cotranscriptional cleavage of rRNA observed by EM in the WT and _spt4_Δ strains, classified as efficient, intermediate, or slow (26). (C) The two strains were grown in SD (−Met) media and were pulse-labeled for 2.5 and 5 min with [methyl-3H]methionine. RNA was isolated and analyzed by using formaldehyde-agarose gel electrophoresis, followed by autoradiography. Positions of rRNA species are indicated. Two exposures of the blot are shown [1 day (Left) and 1 week (Right)]. The ratios of precursors to mature products detected after 2.5-min pulse-labeling are indicated, normalized to WT. (D) Analysis of polysomes and ribosomal subunits in the two strains. Cells were grown in YEPD medium at 30°C, and extracts were analyzed by sucrose density gradient centrifugation. Positions of 40S, 60S, and 80S as well as polysomes are indicated. The arrows with an H indicate halfmers in the _spt4_Δ strain.
Similar articles
- The transcription elongation factor Spt5 influences transcription by RNA polymerase I positively and negatively.
Anderson SJ, Sikes ML, Zhang Y, French SL, Salgia S, Beyer AL, Nomura M, Schneider DA. Anderson SJ, et al. J Biol Chem. 2011 May 27;286(21):18816-24. doi: 10.1074/jbc.M110.202101. Epub 2011 Apr 5. J Biol Chem. 2011. PMID: 21467039 Free PMC article. - Yeast transcription elongation factor Spt5 associates with RNA polymerase I and RNA polymerase II directly.
Viktorovskaya OV, Appling FD, Schneider DA. Viktorovskaya OV, et al. J Biol Chem. 2011 May 27;286(21):18825-33. doi: 10.1074/jbc.M110.202119. Epub 2011 Apr 5. J Biol Chem. 2011. PMID: 21467036 Free PMC article. - The Ras/PKA signaling pathway may control RNA polymerase II elongation via the Spt4p/Spt5p complex in Saccharomyces cerevisiae.
Howard SC, Hester A, Herman PK. Howard SC, et al. Genetics. 2003 Nov;165(3):1059-70. doi: 10.1093/genetics/165.3.1059. Genetics. 2003. PMID: 14668364 Free PMC article. - Crosstalk in gene expression: coupling and co-regulation of rDNA transcription, pre-ribosome assembly and pre-rRNA processing.
Granneman S, Baserga SJ. Granneman S, et al. Curr Opin Cell Biol. 2005 Jun;17(3):281-6. doi: 10.1016/j.ceb.2005.04.001. Curr Opin Cell Biol. 2005. PMID: 15901498 Review. - Coordinated Control of rRNA Processing by RNA Polymerase I.
Scull CE, Schneider DA. Scull CE, et al. Trends Genet. 2019 Oct;35(10):724-733. doi: 10.1016/j.tig.2019.07.002. Epub 2019 Jul 26. Trends Genet. 2019. PMID: 31358304 Free PMC article. Review.
Cited by
- Assembly of regulatory factors on rRNA and ribosomal protein genes in Saccharomyces cerevisiae.
Kasahara K, Ohtsuki K, Ki S, Aoyama K, Takahashi H, Kobayashi T, Shirahige K, Kokubo T. Kasahara K, et al. Mol Cell Biol. 2007 Oct;27(19):6686-705. doi: 10.1128/MCB.00876-07. Epub 2007 Jul 23. Mol Cell Biol. 2007. PMID: 17646381 Free PMC article. - Chromatin-associated genes protect the yeast genome from Ty1 insertional mutagenesis.
Nyswaner KM, Checkley MA, Yi M, Stephens RM, Garfinkel DJ. Nyswaner KM, et al. Genetics. 2008 Jan;178(1):197-214. doi: 10.1534/genetics.107.082602. Genetics. 2008. PMID: 18202368 Free PMC article. - UBF complexes with phosphatidylinositol 4,5-bisphosphate in nucleolar organizer regions regardless of ongoing RNA polymerase I activity.
Sobol M, Yildirim S, Philimonenko VV, Marášek P, Castaño E, Hozák P. Sobol M, et al. Nucleus. 2013 Nov-Dec;4(6):478-86. doi: 10.4161/nucl.27154. Nucleus. 2013. PMID: 24513678 Free PMC article. - Characterization of the Schizosaccharomyces pombe Spt5-Spt4 complex.
Schwer B, Schneider S, Pei Y, Aronova A, Shuman S. Schwer B, et al. RNA. 2009 Jul;15(7):1241-50. doi: 10.1261/rna.1572709. Epub 2009 May 21. RNA. 2009. PMID: 19460865 Free PMC article. - The transcription elongation factor Spt5 influences transcription by RNA polymerase I positively and negatively.
Anderson SJ, Sikes ML, Zhang Y, French SL, Salgia S, Beyer AL, Nomura M, Schneider DA. Anderson SJ, et al. J Biol Chem. 2011 May 27;286(21):18816-24. doi: 10.1074/jbc.M110.202101. Epub 2011 Apr 5. J Biol Chem. 2011. PMID: 21467039 Free PMC article.
References
- Grummt I. Genes Dev. 2003;17:1691–1702. - PubMed
- Nomura M. Cold Spring Harbor Symp. Quant. Biol. 2001;66:555–565. - PubMed
- Nomura M., Nogi Y., Oakes M. In: The Nucleolus, Olson M. O. J., editor. Austin, TX: Landes; 2004. pp. 128–153.
- Cavanaugh A., Hirschler-Laszkiewicz I., Rothblum L. In: The Nucleolus, Olson M. O. J., editor. Georgetown, TX: Landes Bioscience; 2004. pp. 88–127.
Publication types
MeSH terms
Substances
Grants and funding
- RR11823-09/RR/NCRR NIH HHS/United States
- P41 RR011823/RR/NCRR NIH HHS/United States
- GM-63952/GM/NIGMS NIH HHS/United States
- GM-35949/GM/NIGMS NIH HHS/United States
- R01 GM063952/GM/NIGMS NIH HHS/United States
- R01 GM035949/GM/NIGMS NIH HHS/United States
LinkOut - more resources
Full Text Sources
Molecular Biology Databases


