Full and partial genome-wide assembly and disassembly of the yeast transcription machinery in response to heat shock - PubMed (original) (raw)
Full and partial genome-wide assembly and disassembly of the yeast transcription machinery in response to heat shock
Sara J Zanton et al. Genes Dev. 2006.
Abstract
Eukaryotic genes are controlled by sequence-specific DNA-binding proteins, chromatin regulators, general transcription factors, and elongation factors. Here we examine the genome-wide location of representative members of these groups and their redistribution when the Saccharomyces cerevisiae genome is reprogrammed by heat shock. As expected, assembly of active transcription complexes is coupled to eviction of H2A.Z nucleosomes, and disassembly is coupled to the return of nucleosomes. Remarkably, a large number of promoters assemble into partial preinitiation complexes (partial PICs), containing TFIIA, TFIID (and/or SAGA), TFIIB, TFIIE, and TFIIF. However, RNA polymerase II and TFIIH are generally not recruited, and nucleosomes are not displaced. These promoters may be preparing for additional stress that naturally accompany heat stress. For example, we find that oxidative stress, which often occurs with prolonged exposure of cells to high temperature, converts partial PICs into full PICs. Partial PICs therefore represent novel regulated intermediates that assemble at promoters in the midst of chromatin.
Figures
Figure 1.
Enrichment of transcription proteins at promoter regions. (A) Schematic of the major stages in eukaryotic transcriptional regulation. Promoter-bound regulators “orchestrate” promoter access via chromatin remodeling, transcription initiation via general transcription factors (GTFs), and transcript elongation via Pol II and its regulators. (B) Genome-wide occupancy levels at nonpromoter regions located between two convergently transcribed genes. Median occupancy levels from combined 25°C and 37°C data are shown on a linear scale and are relative to null (untagged) or Hxk1 (cytoplasmic protein) control samples. Standard deviations shown here and throughout the paper are drawn from all measured regions in all replicates, and thus reflect a combined region-to-region variance as well as experimental error. The gray background demarcates the null value plus two standard deviations. (C) Occupancy levels at quiescent and constitutively active promoters regions at 25°C. ChIP data for intergenic regions located upstream of a single gene (i.e., flanking genes are transcribed in the same direction) are shown on a log2 scale relative to nonpromoter regions (i.e., the values generated in B). Quiescent (gray bars) and active (black bars) promoters are defined as the median occupancy value in the lower 50th percentile (925 genes) and upper 10th percentile (185 genes) of transcription frequencies, respectively, using the data of Holstege et al. (1998).
Figure 2.
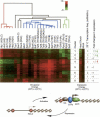
PIC assembly and disassembly are highly coordinated throughout the genome. In the left panel, log2 ratios of 37°C/25°C occupancy changes for intergenic regions that are immediately upstream of a single gene were filtered to obtain values that increased (red) or decreased (green) the most (defined as being in the upper or lower 10th percentile in any one data set, and thus do not represent absolute cutoffs). Black denotes no change. A total of 1952 intergenic regions (72% of the analyzed genome) met these criteria. Since the variance in each column was not normalized, the intensity of the color changes across different columns have not accounted for differences in cross-linking efficiency. Rows representing intergenic regions were clustered by _K_-means (K = 9) (Eisen et al. 1998). Only eight clusters are shown since the ninth cluster corresponded to changes in Pol II and TFIIH occupancy occurring predominantly at the 3' end of the adjacent upstream gene rather than at the 5' end of the downstream gene. Columns representing individual ChIP–chip experiments were clustered hierarchically. The dendro-gram relating them is color-coded according to the broad classifications illustrated in Figure 1A. In the right panel, corresponding changes in gene expression (mRNA levels) are shown, using the same color code as in the left panel. Median transcription frequencies in mRNA per hour (Holstege et al. 1998), and median fold changes in mRNA levels (non-log scale) for each cluster are indicated. The expression data were not used in filtering or clustering. “Mock” denotes a mock temperature shift. The schematic illustrates a simplified model depicting the cycle of PIC assembly and disassembly during heat-shock activation and repression. Asterisks reflect histone acetylation.
Figure 3.
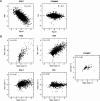
Changes in histone occupancy as a function of changes in Pol II occupancy. (A) In the left panel, log2 fold changes in Htz1 (H2A.Z) occupancy at 5379 intergenic regions are plotted as a function of Rpo21 (Pol II) occupancy changes upon heat shock (25°C → 37°C for 15 min). In the right panel, equivalent data from an untagged (null) control strain are plotted. (B) Log2 fold changes in occupancy of TFIIE, TFIIF, H2A.Z, H2A, and an untagged control in a temperature-sensitive rpb1-1 strain are plotted as a function of Pol II (Rpb2) occupancy changes upon heat inactivation of Pol II (25°C → 37°C for 45 min). The variable number of data points in each graph reflects the number of measurements that were above the local microarray background in both replicates (see Materials and Methods).
Figure 4.
Redistribution of selected transcriptional regulators upon heat shock. (A) Redistribution of sequence-specific regulators. The left cluster plot (columns 1–7) shows occupancy levels at 25°C, where brighter red reflects higher occupancy and black is relatively low occupancy. Column 8 displays the corresponding transcription frequency (log10 scale in mRNA per hour) at 25°C. Median non-log transcription frequency values for each cluster are indicated. Columns 9–15 are corresponding changes in occupancy after a 15-min temperature shift from 25°C to 37°C, as described in Figure 2. Intergenic data for the indicated proteins were filtered as described in Figure 2, using a 2 percentile cutoff for increased occupancy for Yap1, Msn2, and Ifh1; a 2 percentile cutoff for decreased occupancy for Msn2 and Ifh1; a 3 percentile cutoff for increased occupancy of Hsf1 (Hahn et al. 2004); and a 10 percentile cutoff for increased occupancy of Rap1. A total of 213 intergenic regions (8% of the analyzed genome) met these criteria. We found no evidence for any significant decrease in occupancy for Rap1 and Hsf1 (Hahn et al. 2004). These filtering criteria were applied only to occupancy changes for Msn2, Hsf1, Rap1, Ifh1, and Yap1 in columns 10–14. The corresponding data in columns 1–9 and 15–17 were subsequently added. Thus, all row data are linked across columns 1–17. All data in columns 9–15 were used in _K_-means (K = 3) clustering of rows, and were variance normalized (Eisen et al. 1998). The magnitude of the color scale is therefore arbitrary, although log2 linear. Columns 16 and 17 display log2 changes in gene expression. Median non-log values for each cluster are also reported. Below the cluster plots is a model conceptualizing the data from cluster 12, where sequence-specific regulators (shown in color) bind to (red arrows) or dissociate from (green arrow) promoters without concomitant changes in nucleosome occupancy or PIC assembly. (B) Redistribution of histones upon heat shock. Data in columns 1–8 were filtered at the 10 percentile level as described in Figure 2, and clustered into five groups (13–17). A total of 1095 intergenic regions (40%) passed this filtering criteria. Data were not variance normalized. Clusters 14 and 15 are influenced by an overabundance of structural RNA genes (tRNA, snRNA, and snoRNA; p ∼ 10−7–10−10) present in these intergenic regions, and thus were not further analyzed here. Columns 9 and 10 display changes in mRNA levels. The upper and lower bar graphs, respectively, display median occupancy at 25°C and median fold changes in occupancy (25°C → 37°C, 15 min) in cluster 17 for the indicated proteins. The lower apparent occupancy level of the core histones relative to H2A.Z (upper bar graph) is likely due to the fact that S. cerevisiae possesses two genes for each core histone, of which only one is TAP-tagged. Below the graphs is a model illustrating the heat-shock mobilization of Hho1 (H1), shown in blue, at cluster 17 genes. Its precise location is uncertain. As shown, dissociation of H1 and increased H3 acetylation (*) are not concomitant with Pol II recruitment, and thus are likely to occur prior to full PIC assembly at these genes.
Figure 5.
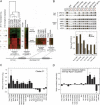
Partial PIC assembly. (A) Redistribution of GTFs in response to heat shock. Occupancy changes were filtered at the 10 percentile level, clustered by _K_-means into five groups (18–22), and variance normalized, resulting in an arbitrary log2 color scale. A total of 1197 intergenic regions (44%) passed this filtering criteria. The Htz1 (H2A.Z) data (column 1) were not used for filtering, but were subsequently reattached. Cluster 22 is not displayed since it corresponded to Rpo21 and Ssl2 binding at the 3' end of the adjacent upstream gene rather than in promoter regions. Cluster 20 was further subclustered (K = 2) using only the ChIP–chip data in columns 10–15, which represent occupancy changes occurring in the intergenic region (IGR; see diagram) immediately downstream from the corresponding cluster 20 gene. Changes in gene expression are displayed in columns 8–9 and 16–17. (B) Standard ChIP analysis demonstrating partial PIC assembly. Samples were prepared as for ChIP–chip as in A except that gene-specific primers were used to PCR-amplify the promoter regions of the indicated genes (see Supplemental Material). Full PIC assembly genes were chosen from cluster 4 (Fig. 2). Partial PIC assembly genes were chosen from clusters 6, 7, and 21. Shown are representative ethidium-bromide-stained gels in which the PCR products are in the linear response range. At least five independent replicates were performed for each experiment, and representative data are shown. Template DNA was omitted in the lane marked “NTC.” Due to differences in protein-specific and gene-specific cross-linking efficiencies, only matched pairs of 37°C and 25°C data can be compared. To provide a summarized measure of the fold changes in occupancy upon heat shock, log2 ratios for all predicted partial PIC complexes were averaged and plotted as a bar graph (gray bars). The same was done for those predicted to undergo full PIC assembly (black bars). Quantitation and error values for individual genes are presented in Supplementary Figure S3. (C) Bar graph quantitation of the median log2 occupancy changes for the indicated factors at the promoter region in cluster 21 (shown in A). Other core histones behaved equivalently to H4 (data not shown). (D) Bar graph quantitation of the median log2 occupancy changes for all nonpromoter intergenic regions (i.e., downstream from two convergently transcribed genes) that have a high-level Rpo21 acquisition (defined as being in upper 10 percentile). The large standard deviation for TFIIH is consistent with the observation in A that TFIIH does not associate with some Pol II complexes.
Figure 6.
Conversion of partial PICs to full PICs. (A) properties and relationships of partially remodeled. Cluster numbers and their properties are reported in each box. Log10 _p -_values relating any two boxes are indicated along the connecting line. Properties were selected from Supplementary Table S2. (B) Occupancy changes of Rpo21 and H2A. Z in response to heat shock and a second stress. Cultures were treated with heat stress (abrupt shift to 37°C) and a second stress as indicated below each bar. "none" indicates heat stress alone. Exposure times for each stress are indicated above sets of bar graphs, and are based on conditions reported previously (Gasch et al. 2000). ChIP-chip assays were performed. Cluster medians for log2 changes in occupancy of H2A. Z (Htz1, black bars) and Pol II (Rpo21, gray bars) are shown for cluster 8 (left pannel) and cluster 4 (right panel) genes, and are relative to cells maintained at 25°C. (C) Standard ChIP demonstrating conversion of partial PICs to full PICs with hydrogen peroxide ChIP assays were as described for B, except that gene-specific primers were used to amplify the promoter regions of the indicated genes by PCR. Shown are representative ethidium-bromide stained gels. Template DNA was omitted in the lane marked "NTC". (D) Changes in Pol II (Rpo21) and H2A.Z (Htz1) occupancy at cluster 8 (left panel) and cluster 4 (right panel) genes upon prolonged incubation at 37°C. Changes are relative to cells maintained at 25°C. The curves are drawn through zero since this represents the reference state.
Figure 7.
A model for full and partial PICs that are widespread throughout the yeast genome. Models roughly correspond to the behaviors of clusters 18–21 (Fig. 5A), as drawn from left to right. The bottom illustrations represent the inactive ground state chromatin structure. Upon heat shock, partial PIC assembly occurs at some genes (third pathway) and full assembly at others (fourth pathway). At many highly active housekeeping genes such as the ribosomal protein genes, heat shock leads to a transient return to the ground state primarily through the TFIID pathway (first pathway). At other genes, the PIC partly disassembles (second pathway). (A) TFIIA; (B) TFIIB; (D) TFIID; (E) TFIIE; (F) TFIIF; (H) TFIIH; (M) Mot1; (N) NC2; (S) SAGA; (**) H3 acetylation. The depicted partial PICs represent a minimal composition. Other regulatory proteins including a variety of sequence-specific regulators are likely to be present, and some of the proteins shown could be absent at certain promoters.
Similar articles
- Domain-wide displacement of histones by activated heat shock factor occurs independently of Swi/Snf and is not correlated with RNA polymerase II density.
Zhao J, Herrera-Diaz J, Gross DS. Zhao J, et al. Mol Cell Biol. 2005 Oct;25(20):8985-99. doi: 10.1128/MCB.25.20.8985-8999.2005. Mol Cell Biol. 2005. PMID: 16199876 Free PMC article. - Genome-wide structure and organization of eukaryotic pre-initiation complexes.
Rhee HS, Pugh BF. Rhee HS, et al. Nature. 2012 Jan 18;483(7389):295-301. doi: 10.1038/nature10799. Nature. 2012. PMID: 22258509 Free PMC article. - Different requirements of the SWI/SNF complex for robust nucleosome displacement at promoters of heat shock factor and Msn2- and Msn4-regulated heat shock genes.
Erkina TY, Tschetter PA, Erkine AM. Erkina TY, et al. Mol Cell Biol. 2008 Feb;28(4):1207-17. doi: 10.1128/MCB.01069-07. Epub 2007 Dec 10. Mol Cell Biol. 2008. PMID: 18070923 Free PMC article. - The role of chromatin structure in regulating stress-induced transcription in Saccharomyces cerevisiae.
Uffenbeck SR, Krebs JE. Uffenbeck SR, et al. Biochem Cell Biol. 2006 Aug;84(4):477-89. doi: 10.1139/o06-079. Biochem Cell Biol. 2006. PMID: 16936821 Review. - Primary Role of the Nucleosome.
Kornberg RD, Lorch Y. Kornberg RD, et al. Mol Cell. 2020 Aug 6;79(3):371-375. doi: 10.1016/j.molcel.2020.07.020. Mol Cell. 2020. PMID: 32763226 Review.
Cited by
- Modelling the conditional regulatory activity of methylated and bivalent promoters.
Budden DM, Hurley DG, Crampin EJ. Budden DM, et al. Epigenetics Chromatin. 2015 Jun 19;8:21. doi: 10.1186/s13072-015-0013-9. eCollection 2015. Epigenetics Chromatin. 2015. PMID: 26097508 Free PMC article. - The linker histone plays a dual role during gametogenesis in Saccharomyces cerevisiae.
Bryant JM, Govin J, Zhang L, Donahue G, Pugh BF, Berger SL. Bryant JM, et al. Mol Cell Biol. 2012 Jul;32(14):2771-83. doi: 10.1128/MCB.00282-12. Epub 2012 May 14. Mol Cell Biol. 2012. PMID: 22586276 Free PMC article. - Histone exchange is associated with activator function at transcribed promoters and with repression at histone loci.
Kassem S, Ferrari P, Hughes AL, Soudet J, Rando OJ, Strubin M. Kassem S, et al. Sci Adv. 2020 Sep 2;6(36):eabb0333. doi: 10.1126/sciadv.abb0333. Print 2020 Sep. Sci Adv. 2020. PMID: 32917590 Free PMC article. - Independent RNA polymerase II preinitiation complex dynamics and nucleosome turnover at promoter sites in vivo.
Grimaldi Y, Ferrari P, Strubin M. Grimaldi Y, et al. Genome Res. 2014 Jan;24(1):117-24. doi: 10.1101/gr.157792.113. Epub 2013 Dec 2. Genome Res. 2014. PMID: 24298073 Free PMC article. - NC2 complex is a key factor for the activation of catalase-3 transcription by regulating H2A.Z deposition.
Cui G, Dong Q, Duan J, Zhang C, Liu X, He Q. Cui G, et al. Nucleic Acids Res. 2020 Sep 4;48(15):8332-8348. doi: 10.1093/nar/gkaa552. Nucleic Acids Res. 2020. PMID: 32633757 Free PMC article.
References
- Akoulitchev S., Makela T.P., Weinberg R.A., Reinberg D. Requirement for TFIIH kinase activity in transcription by RNA polymerase II. Nature. 1995;377:557–560. - PubMed
- Basehoar A.D., Zanton S.J., Pugh B.F. Identification and distinct regulation of yeast TATA box-containing genes. Cell. 2004;116:699–709. - PubMed
Publication types
MeSH terms
Substances
LinkOut - more resources
Full Text Sources
Other Literature Sources
Molecular Biology Databases
Research Materials


