Insulin signaling diverges into Akt-dependent and -independent signals to regulate the recruitment/docking and the fusion of GLUT4 vesicles to the plasma membrane - PubMed (original) (raw)
Insulin signaling diverges into Akt-dependent and -independent signals to regulate the recruitment/docking and the fusion of GLUT4 vesicles to the plasma membrane
Eva Gonzalez et al. Mol Biol Cell. 2006 Oct.
Abstract
Insulin modulates glucose disposal in muscle and adipose tissue by regulating the cellular redistribution of the GLUT4 glucose transporter. Protein kinase Akt/PKB is a central mediator of insulin-regulated translocation of GLUT4; however, the GLUT4 trafficking step(s) regulated by Akt is not known. Here, we use acute pharmacological Akt inhibition to show that Akt is required for insulin-stimulated exocytosis of GLUT4 to the plasma membrane. Our data also suggest that the AS160 Rab GAP is not the only Akt target required for insulin-stimulated GLUT4 translocation. Using a total internal reflection microscopy assay, we show that Akt activity is specifically required for an insulin-mediated prefusion step involving the recruitment and/or docking of GLUT4 vesicles to within 250 nm of the plasma membrane. Moreover, the insulin-stimulated fusion of GLUT4 vesicles with the plasma membrane can occur independently of Akt activity, although based on inhibition by wortmannin, it is dependent on phosphatidylinositol 3' kinase activity. Hence, to achieve full redistribution of GLUT4 into the plasma membrane, insulin signaling bifurcates to independently regulate both fusion and a prefusion step(s).
Figures
Figure 1.
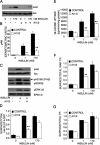
Inhibition of Akt impairs GLUT4 translocation and glucose uptake in 3T3-L1 adipocytes. (A) 3T3-L1 adipocytes were treated with 1 μM AI1/2 or vehicle for 1 h before insulin stimulation for 15 min. Cell lysates were analyzed in immunoblots by using noted antibodies. (B) Densitometric analyses from pooled immunoblot data. The means ± SE of three independent experiments are shown. (C) Immunoblot analyses of adipocytes stimulated with 1 nM insulin for 15 min. As noted, some samples were treated with 1 μM AI1/2 for 1 h before insulin stimulation. Phosphorylated AS160 (arrow) was detected with the PAS antibody. (D) Surface-to-total distribution of HA-GLUT4-GFP. Each bar is the mean ± SE of three independent experiments. The surface-to-total HA-GLUT4-GFP distribution was normalized to the distribution in cells stimulated with 1 nM insulin for 30 min. As noted, some samples were treated with 1 μM AI1/2 for 1 h before 30-min insulin stimulation. (E) Glucose uptake in adipocytes. Cells were treated with vehicle or 1 μM AI1/2 for 1 h before 30-min insulin stimulation. Each bar is the mean ± SE of four independent experiments. (F and G) Surface-to-total distribution of IRAP-TR chimera (F) and TR (G) in adipocytes. Cells were treated with vehicle or 1 μM AI1/2 for 1 h before 30-min incubation in insulin. Each bar is the mean ± SE of two independent experiments. The surface-to-total distributions were normalized to the distribution in control cells stimulated with 1 nM insulin. *p < 0.05, **p < 0.01 versus cells that were not treated with AI1/2 (analysis of variance [ANOVA]).
Figure 2.
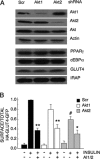
shRNA-mediated Akt knockdown impairs insulin-induced GLUT4 translocation. (A) Immunoblot analyses of extracts from adipocytes expressing scrambled, Akt1- or Akt2-specific shRNA. (B) Surface-to-total distribution of HA-GLUT4-GFP in control, Akt1, and Akt2 knockdown adipocytes. Insulin (1 nM) and 1 μM AI1/2 were used. Each bar is the mean ± SE of three independent experiments. In each experiment, the surface-to-total HA-GLUT4-GFP distribution was normalized to the distribution in control insulin-stimulated cells. *p < 0.05, **p < 0.01 versus cells that were not treated with AI1/2; #p < 0.01 versus insulin-stimulated control cells (ANOVA).
Figure 3.
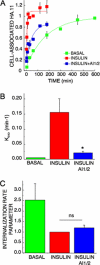
Akt regulates insulin-induced GLUT4 exocytosis but not insulin inhibition of GLUT4 internalization. (A) Steady-state basal and insulin-stimulated GLUT4 exocytosis kinetics in 3T3-L1 adipocytes. The data are the mean ± SE of three independent experiments for the insulin-stimulated state and two experiments for the basal state. Insulin (1 nM) and 1 μM AI1/2 were used. The lines are a fit of the data to (Cy3/GFP)t = (HA-GLUT4-GFP)plateau − [(HA-GLUT4-GFP)intracellular × (e−kexo*t)]; where Kexo is the exocytosis rate constant, t is the time of incubation, Cy3/GFP is cell-associated HA.11 at time t, (HA-GLUT4-GFP)plateau is the Cy3-to-GFP plateau level, and (HA-GLUT4-GFP)intracellular is the amount of HA-GLUT4-GFP intracellular at time 0. (B) Basal and insulin-stimulated GLUT4 Kexo in the presence or absence of AI1/2. Each bar is the mean ± SE of two or three independent experiments. *p < 0.05 compared with insulin-stimulated state in the absence of the Akt inhibitor (ANOVA). (C) Basal and insulin-stimulated GLUT4 internalization rate parameter in the presence or absence of AI1/2. Each bar is the mean ± SE of two to four independent experiments. The data are normalized to the internalization rate parameter measured for control cells in the insulin-stimulated state. The internalization rate parameter is proportional to the internalization rate constant but is not the rate constant, because different fluorophores are used to measure surface and internal HA-GLUT4-GFP.
Figure 4.
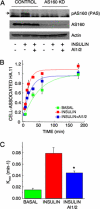
Akt regulates GLUT4 exocytosis by AS160-dependent and -independent mechanisms. (A) Immunoblot analyses of cell extracts from adipocytes expressing scrambled or AS160 shRNA. Phosphorylated AS160 (arrow) was detected with the PAS antibody. (B) Steady-state basal and insulin-stimulated GLUT4 exocytosis kinetics in AS160 knockdown 3T3-L1 adipocytes. The data are the mean ± SE of three independent experiments in the insulin-stimulated state and two independent experiments in the basal state. Insulin (1 nM) and 1 μM AI1/2 were used. (C) Basal and insulin-stimulated GLUT4 Kexo in the presence or absence of AI1/2 in AS160 knockdown adipocytes. Each data point is the mean ± SE of two to three independent experiments. *p < 0.05 compared with insulin-stimulated state in the absence of the Akt inhibitor (ANOVA).
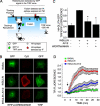
Figure 5.
Akt signaling is required for insulin-induced recruitment/docking of GLUT4 vesicles to the plasma membrane. (A) TIRF translocation assay. HA-GLUT4-GFP fluorescence in basal or insulin-stimulated cells was measured in the epifluorescence mode and in the TIRF mode. In the epifluorescence mode, translocation is measured as the exposure of the HA-epitope of HA-GLUT4-GFP on the surface of intact adipocytes, which is measured by IF. The HA fluorescence is normalized to GFP in cells also detected by epifluorescence (Lampson et al., 2000). In the TIRF assay, redistribution of HA-GLUT4-GFP to within 250 nm of the membrane is measured by GFP fluorescence. The TIRF GFP signal is normalized to the total amount of HA-GLUT4-GFP per cell measured in the epifluorescence mode of the microscope. The TIRF assay measures redistribution to within 250 nm of the PM independently of whether the GLUT4 is inserted into the PM (that is, independently of vesicle fusion). (B) Representative images of HA-GLUT4-GFP in the basal state and after 1 nM insulin stimulation for 30 min ± 1 μM AI1/2. Total HA-GLUT4-GFP was determined by GFP fluorescence in the epifluorescence mode, HA-GLUT4-GFP inserted in the PM was determined by indirect immunofluorescence of the HA epitope, and HA-GLUT4-GFP in the TIRF zone was determined by GFP fluorescence in the TIRF mode. (C) Quantification of GLUT4 redistribution measured using TIRF microscopy. For each experiment, the data are normalized to the insulin stimulated state. The values shown are the means ± SE of three independent experiments. AI1/2 (1 μM), 100 nM wortmannin, and 1 nM insulin were used. *p < 0.05 versus the insulin-stimulated state (ANOVA). (D) Quantification of time-lapsed TIRF microscopy of HA-GLUT4-GFP in the TIRF zone. Images were acquired every 30 s for 30 min. Insulin (1 nM) or vehicle (mock) was added after the fifth frame (noted by the arrow). AI1/2 (1 μM) was added 1 h before recording. Data shown are the mean ± SE from six to nine cells per condition, derived from three independent experiments.
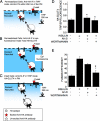
Figure 6.
PI3-kinase but not Akt signaling regulates insulin-induced GLUT4 vesicle fusion to the PM. (A) HA-GLUT4 redistribution to within 250 nm of the dorsal PM was measured by IF of permeabilized cells using TIRF microscopy. Although all the anti-HA antibodies in the cells are bound by fluorescently labeled secondary antibody, only the fluorescent secondary antibody bound to anti-HA-epitope antibodies within the TIRF zone are excited (red stars). (B) The total amount of HA-GLUT4 in permeabilized cells was determined by epifluorescence microscopy. The ratio of the TIRF to epifluorescence is a measure of the redistribution of HA-GLUT4 to within 250 nm of the dorsal PM (see D). (C) HA-GLUT4 inserted into the PM was determined IF of intact (nonpermeabilized cells) by TIRF microscopy. The ratio of the TIRF fluorescence in intact cells to TIRF fluorescence on permeabilized cells (see A) is proportional to the efficiency of HA-GLUT4 vesicle fusion with the PM, because it reflects the fraction of HA-GLUT4 within 250 nm of the membrane that is inserted in the PM. (D) Measurement of insulin-induced GLUT4 vesicle recruitment/docking in 3T3-L1 adipocytes stably expressing HA-GLUT4. The data are the ratio of the HA-GLUT4 within 250 nm of the PM of permeabilized cells, as determined by IF (anti-HA) in TIRF mode (see A), divided by the total HA-GLUT4 in cells determined in epifluorescence mode of the same samples (see B). The data are normalized to the insulin-stimulated state of control cells. The data are the means ± SE of three to six independent experiments. Insulin (1 nM), 100 nM wortmannin, and 1 μM AI1/2 were used. (E) Efficiency of GLUT4 vesicle fusion with PM. The data are the ratio of the HA-GLUT4 in the PM, as determined by IF in TIRF mode of intact cells (see C) divided by the HA-GLUT4 within the TIRF zone, as determined in TIRF mode of permeabilized cells (see A). The means ± SE of three to six independent experiments are shown. Insulin (1 nM), 100 nM wortmannin, and 1 μM AI1/2 were used. The difference between insulin-stimulated AI1/2-treated cells and insulin-stimulated control cells was not statistically different. *p < 0.001 versus the insulin-stimulated control cells; #p < 0.05 versus AI1/2, insulin-stimulated cells (ANOVA).
Similar articles
- Identification of a distal GLUT4 trafficking event controlled by actin polymerization.
Lopez JA, Burchfield JG, Blair DH, Mele K, Ng Y, Vallotton P, James DE, Hughes WE. Lopez JA, et al. Mol Biol Cell. 2009 Sep;20(17):3918-29. doi: 10.1091/mbc.e09-03-0187. Epub 2009 Jul 15. Mol Biol Cell. 2009. PMID: 19605560 Free PMC article. - Loss of AS160 Akt substrate causes Glut4 protein to accumulate in compartments that are primed for fusion in basal adipocytes.
Brewer PD, Romenskaia I, Kanow MA, Mastick CC. Brewer PD, et al. J Biol Chem. 2011 Jul 29;286(30):26287-97. doi: 10.1074/jbc.M111.253880. Epub 2011 May 24. J Biol Chem. 2011. PMID: 21613213 Free PMC article. - Functional consequence of targeting protein kinase B/Akt to GLUT4 vesicles.
Ducluzeau PH, Fletcher LM, Welsh GI, Tavaré JM. Ducluzeau PH, et al. J Cell Sci. 2002 Jul 15;115(Pt 14):2857-66. doi: 10.1242/jcs.115.14.2857. J Cell Sci. 2002. PMID: 12082147 - Mapping insulin/GLUT4 circuitry.
Rowland AF, Fazakerley DJ, James DE. Rowland AF, et al. Traffic. 2011 Jun;12(6):672-81. doi: 10.1111/j.1600-0854.2011.01178.x. Epub 2011 Mar 15. Traffic. 2011. PMID: 21401839 Review. - Regulated membrane trafficking of the insulin-responsive glucose transporter 4 in adipocytes.
Watson RT, Kanzaki M, Pessin JE. Watson RT, et al. Endocr Rev. 2004 Apr;25(2):177-204. doi: 10.1210/er.2003-0011. Endocr Rev. 2004. PMID: 15082519 Review.
Cited by
- Role and mechanism of specialized pro-resolving mediators in obesity-associated insulin resistance.
Liu X, Tang Y, Luo Y, Gao Y, He L. Liu X, et al. Lipids Health Dis. 2024 Jul 30;23(1):234. doi: 10.1186/s12944-024-02207-9. Lipids Health Dis. 2024. PMID: 39080624 Free PMC article. Review. - Microtubule-mediated GLUT4 trafficking is disrupted in insulin-resistant skeletal muscle.
Knudsen JR, Persson KW, Henriquez-Olguin C, Li Z, Di Leo N, Hesselager SA, Raun SH, Hingst JR, Trouillon R, Wohlwend M, Wojtaszewski JFP, Gijs MAM, Jensen TE. Knudsen JR, et al. Elife. 2023 Apr 19;12:e83338. doi: 10.7554/eLife.83338. Elife. 2023. PMID: 37073948 Free PMC article. - GLUT4 On the move.
Fazakerley DJ, Koumanov F, Holman GD. Fazakerley DJ, et al. Biochem J. 2022 Feb 11;479(3):445-462. doi: 10.1042/BCJ20210073. Biochem J. 2022. PMID: 35147164 Free PMC article. - Tmod3 Phosphorylation Mediates AMPK-Dependent GLUT4 Plasma Membrane Insertion in Myoblasts.
Shrestha MM, Lim CY, Bi X, Robinson RC, Han W. Shrestha MM, et al. Front Endocrinol (Lausanne). 2021 Apr 20;12:653557. doi: 10.3389/fendo.2021.653557. eCollection 2021. Front Endocrinol (Lausanne). 2021. PMID: 33959097 Free PMC article. - Signaling Heterogeneity is Defined by Pathway Architecture and Intercellular Variability in Protein Expression.
Norris D, Yang P, Shin SY, Kearney AL, Kim HJ, Geddes T, Senior AM, Fazakerley DJ, Nguyen LK, James DE, Burchfield JG. Norris D, et al. iScience. 2021 Jan 29;24(2):102118. doi: 10.1016/j.isci.2021.102118. eCollection 2021 Feb 19. iScience. 2021. PMID: 33659881 Free PMC article.
References
- Bae S. S., Cho H., Mu J., Birnbaum M. J. Isoform-specific regulation of insulin-dependent glucose uptake by Akt/protein kinase B. J. Biol. Chem. 2003;278:49530–49536. - PubMed
- Bogan J. S., Hendon N., McKee A. E., Tsao T. S., Lodish H. F. Functional cloning of TUG as a regulator of GLUT4 glucose transporter trafficking. Nature. 2003;425:727–733. - PubMed
- Bose A., Guilherme A., Robida S. I., Nicoloro S. M., Zhou Q. L., Jiang Z. Y., Pomerleau D. P., Czech M. P. Glucose transporter recycling in response to insulin is facilitated by myosin Myo1c. Nature. 2002;420:821–824. - PubMed
- Chiang S., Baumann C., Kanzaki M., Thurmond D., Watson R., Neudauer C., Macara I., Pessin J., Saltiel A. Insulin-stimulated GLUT4 translocation requires the CAP-dependent activation of TC10. Nature. 2001;410:944–948. - PubMed
Publication types
MeSH terms
Substances
LinkOut - more resources
Full Text Sources
Other Literature Sources
Medical
Molecular Biology Databases
Miscellaneous
