Quantification of protein half-lives in the budding yeast proteome - PubMed (original) (raw)
Quantification of protein half-lives in the budding yeast proteome
Archana Belle et al. Proc Natl Acad Sci U S A. 2006.
Abstract
A complete description of protein metabolism requires knowledge of the rates of protein production and destruction within cells. Using an epitope-tagged strain collection, we measured the half-life of >3,750 proteins in the yeast proteome after inhibition of translation. By integrating our data with previous measurements of protein and mRNA abundance and translation rate, we provide evidence that many proteins partition into one of two regimes for protein metabolism: one optimized for efficient production or a second optimized for regulatory efficiency. Incorporation of protein half-life information into a simple quantitative model for protein production improves our ability to predict steady-state protein abundance values. Analysis of a simple dynamic protein production model reveals a remarkable correlation between transcriptional regulation and protein half-life within some groups of coregulated genes, suggesting that cells coordinate these two processes to achieve uniform effects on protein abundances. Our experimental data and theoretical analysis underscore the importance of an integrative approach to the complex interplay between protein degradation, transcriptional regulation, and other determinants of protein metabolism.
Conflict of interest statement
Conflict of interest statement: No conflicts declared.
Figures
Fig. 1.
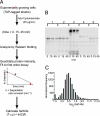
Determination of protein half-life by using the TAP-tagged strains. (A) Schematic diagram of the translation shut-off assay used to determine the half-life of proteins in the yeast proteome. (B) The degradation rate constants of the TAP-tagged proteins were quantified by measuring the relative intensity of each protein by quantitative Western blotting at 0, 15, and 45 min after cycloheximide treatment. The intensity data were fit to a first-order decay function to estimate the degradation rate constant, which then was used to calculate a half-life. The Western blot shows degradation profiles for five representative TAP-tagged proteins. (C) Normalized distribution of the half-lives of the observed yeast proteins. The bins are log2 increments with the upper boundary indicated.
Fig. 2.
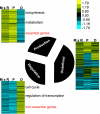
Clustering genes by similarity in protein metabolism parameters correlates with function and localization. The 3,751 yeast proteins were clustered based on protein production rate [mRNA abundance (M) x ribosome density (R)], protein abundance (P), and degradation rate constant (D). See Data Sources in Methods for details on the data sets used. Clusters with similar profiles were grouped together and graphically visualized by using colors to represent the direction and measure of the attribute (see Supporting Methods for details). A high attribute value is shown in shades of yellow, and a low attribute value is indicated with shades of blue. The black pie slices indicate the relative numbers of proteins belonging to each cluster. Clusters were analyzed for functional enrichment and localization categories. A representative list of significantly enriched GO terms is indicated in black. The entire list of significant GO terms and localization categories obtained in the analysis is described in Tables 4 and 5.
Fig. 3.
Protein half-life and production rate influence protein abundance. (A) Heat map illustrating the functional relationship between protein production rate (mRNA abundance × ribosome density; y axis), degradation rate constant (x axis), and protein abundance (color-coded). See Data Sources in Methods for details on the data sets used. Each point represents a 2D bin, including all proteins with a degradation rate constant and protein production rate in a defined range. The color of the bin represents the average abundance of the proteins contained within it. Higher values are indicated in shades of red, and lower values in shades of blue. Empty and near-empty bins are colored black. (B) Two-dimensional plot of the relationship between protein abundance and protein production (Upper) or degradation rate constant (Lower). The plots are generated by using a moving average of a window of 100 genes.
Fig. 4.
A simple model for protein metabolism. (A) Schematic of a model for protein metabolism and the corresponding steady-state prediction for protein abundance, where M is absolute mRNA abundance, P is protein concentration, R is the rate of translation per mRNA molecule (approximated by experimental data on ribosome density), D is protein degradation rate constant, and V is growth rate (volume increase factor per unit time). See Data Sources in Methods for details on the data sets used. (B) Correlation between observed and predicted protein abundance. Bar graph shows the P value (y axis) of rejecting the independence hypothesis by using the Spearman test [the Spearman rank correlations (_r_s) are indicated on the bars], between observed and predicted protein abundance, when using M, only mRNA abundance; M+D, mRNA abundance and degradation rate constant including growth correction; M+R, mRNA abundance and ribosome density; or all of the parameters described in the steady state protein metabolism equation. (C) Scatter plot showing the relationship between the observed and predicted protein abundances.
Fig. 5.
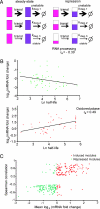
Correlation between mRNA changes and protein half-life. (A) Model for buffering protein stability differences in regulated transcription modules. Schematic of a transcription module made up of three genes with different protein degradation rate constants shown at steady state (Left) and during the transition to a repressed state (Right). The three coregulated genes produce mRNA (shown in pink) coding for proteins (in purple) of different stabilities as indicated by the different _k_deg (1 is least stable, and 3 is the most stable protein). When the genes in the module are transcriptionally repressed (Right) and the cell is aiming to maintain the same relative ratios of protein abundance as in steady state, mRNAs coding for stable proteins will be repressed more than mRNAs coding for unstable ones (indicated by the relative extent of pink filling). The same is true for cases of induction (data not shown). (B) Relationship between fold change in expression and protein half-life in the genes belonging to two transcription modules. The profile of the RNA processing module in osmotic stress (51 genes; ref. 9) (Upper) and the oxidoreductase module (44 genes; ref. 7) in response to DTT (Lower) are shown. The mRNA data come from the time point of maximum mRNA repression (for osmotic stress, 20 min) or activation (for oxidoreductase, 45 min) during time courses after a stress. The lines give the least-square fit to the data points. (C) Global correlation between protein half-life and fold change in gene expression in transcription modules. For 1,200 previously described transcription modules (10), we analyzed 27 different time courses of mRNA expression after a stress (, –14). For each module and each condition, we tested whether the magnitude of transcription induction or repression correlates with the half-life of the protein encoded by the module’s genes. To that end, we calculated the Spearman rank correlation between fold change in gene expression and protein half-life and collected all module-condition pairs for which the correlation was significant (P < 1_e_−3). The scatter plot shows the average fold change in expression (x axis) and Spearman rank correlation (y axis) for significant pairs The plot reflects distinct behaviors for induced (red) and repressed (green) modules, suggesting that, in agreement with our theoretical prediction, in cases where correlation between half-life and expression is observed, it increases the uniformity of the module’s response at the protein level.
Similar articles
- Turnover of polyadenylated messenger RNA in fission yeast. Evidence for the control of protein synthesis at the translational level.
Fraser RS. Fraser RS. Eur J Biochem. 1975 Dec 15;60(2):477-86. doi: 10.1111/j.1432-1033.1975.tb21026.x. Eur J Biochem. 1975. PMID: 1204651 - Quantification of mRNA and protein and integration with protein turnover in a bacterium.
Maier T, Schmidt A, Güell M, Kühner S, Gavin AC, Aebersold R, Serrano L. Maier T, et al. Mol Syst Biol. 2011 Jul 19;7:511. doi: 10.1038/msb.2011.38. Mol Syst Biol. 2011. PMID: 21772259 Free PMC article. - Evolutionary rate covariation reveals shared functionality and coexpression of genes.
Clark NL, Alani E, Aquadro CF. Clark NL, et al. Genome Res. 2012 Apr;22(4):714-20. doi: 10.1101/gr.132647.111. Epub 2012 Jan 27. Genome Res. 2012. PMID: 22287101 Free PMC article. - Messenger RNA transport in the opportunistic fungal pathogen Candida albicans.
McBride AE. McBride AE. Curr Genet. 2017 Dec;63(6):989-995. doi: 10.1007/s00294-017-0707-6. Epub 2017 May 16. Curr Genet. 2017. PMID: 28512683 Free PMC article. Review. - Insights into the regulation of protein abundance from proteomic and transcriptomic analyses.
Vogel C, Marcotte EM. Vogel C, et al. Nat Rev Genet. 2012 Mar 13;13(4):227-32. doi: 10.1038/nrg3185. Nat Rev Genet. 2012. PMID: 22411467 Free PMC article. Review.
Cited by
- A proteomic atlas of the legume Medicago truncatula and its nitrogen-fixing endosymbiont Sinorhizobium meliloti.
Marx H, Minogue CE, Jayaraman D, Richards AL, Kwiecien NW, Siahpirani AF, Rajasekar S, Maeda J, Garcia K, Del Valle-Echevarria AR, Volkening JD, Westphall MS, Roy S, Sussman MR, Ané JM, Coon JJ. Marx H, et al. Nat Biotechnol. 2016 Nov;34(11):1198-1205. doi: 10.1038/nbt.3681. Epub 2016 Oct 17. Nat Biotechnol. 2016. PMID: 27748755 Free PMC article. - Global protein turnover quantification in Escherichia coli reveals cytoplasmic recycling under nitrogen limitation.
Gupta M, Johnson ANT, Cruz ER, Costa EJ, Guest RL, Li SH, Hart EM, Nguyen T, Stadlmeier M, Bratton BP, Silhavy TJ, Wingreen NS, Gitai Z, Wühr M. Gupta M, et al. Nat Commun. 2024 Jul 13;15(1):5890. doi: 10.1038/s41467-024-49920-8. Nat Commun. 2024. PMID: 39003262 Free PMC article. - Combinatorial complexity and compositional drift in protein interaction networks.
Deeds EJ, Krivine J, Feret J, Danos V, Fontana W. Deeds EJ, et al. PLoS One. 2012;7(3):e32032. doi: 10.1371/journal.pone.0032032. Epub 2012 Mar 8. PLoS One. 2012. PMID: 22412851 Free PMC article. - Quantitative proteomics and network analysis of SSA1 and SSB1 deletion mutants reveals robustness of chaperone HSP70 network in Saccharomyces cerevisiae.
Jarnuczak AF, Eyers CE, Schwartz JM, Grant CM, Hubbard SJ. Jarnuczak AF, et al. Proteomics. 2015 Sep;15(18):3126-39. doi: 10.1002/pmic.201400527. Epub 2015 Apr 10. Proteomics. 2015. PMID: 25689132 Free PMC article.
References
- Ghaemmaghami S., Huh W. K., Bower K., Howson R. W., Belle A., Dephoure N., O’Shea E. K., Weissman J. S. Nature. 2003;425:737–741. - PubMed
- Huh W. K., Falvo J. V., Gerke L. C., Carroll A. S., Howson R. W., Weissman J. S., O’Shea E. K. Nature. 2003;425:686–691. - PubMed
- Washburn M. P., Wolters D., Yates J. R., III Nat. Biotechnol. 2001;19:242–247. - PubMed
Publication types
MeSH terms
Substances
LinkOut - more resources
Full Text Sources
Other Literature Sources
Molecular Biology Databases


