In vivo mature immunological synapses forming SMACs mediate clearance of virally infected astrocytes from the brain - PubMed (original) (raw)
. 2006 Sep 4;203(9):2095-107.
doi: 10.1084/jem.20060420. Epub 2006 Aug 21.
Clare E Thomas, James F Curtin, Gwendalyn D King, Kolja Wawrowsky, Marianela Candolfi, Wei-Dong Xiong, Chunyan Liu, Kurt Kroeger, Olivier Boyer, Jerzy Kupiec-Weglinski, David Klatzmann, Maria G Castro, Pedro R Lowenstein
Affiliations
- PMID: 16923851
- PMCID: PMC1997281
- DOI: 10.1084/jem.20060420
In vivo mature immunological synapses forming SMACs mediate clearance of virally infected astrocytes from the brain
Carlos Barcia et al. J Exp Med. 2006.
Abstract
The microanatomy of immune clearance of infected brain cells remains poorly understood. Immunological synapses are essential anatomical structures that channel information exchanges between T cell-antigen-presenting cells (APC) during the priming and effector phases of T cells' function, and during natural killer-target cell interactions. The hallmark of immunological synapses established by T cells is the formation of the supramolecular activation clusters (SMACs), in which adhesion molecules such as leukocyte function-associated antigen 1 segregate to the peripheral domain of the immunological synapse (p-SMAC), which surrounds the T cell receptor-rich or central SMAC (c-SMAC). The inability so far to detect SMAC formation in vivo has cast doubts on its functional relevance. Herein, we demonstrate that the in vivo formation of SMAC at immunological synapses between effector CD8+ T cells and target cells precedes and mediates clearance of virally infected brain astrocytes.
Figures
Figure 1.
The systemic immune response clears infected astrocytes and virus genomes from the brain. (A) Virally infected cells are astrocytes. To determine the cellular nature of infected cells, confocal microscopy of triple immunolabeling of TK, a marker of adenovirus infection (green); GFAP, an astrocyte marker (magenta); and NeuN, a neuronal marker (red), was performed in 50-μm thick vibratome sections from the brains of animals studied 30 d after intracranial injection of virus, in the absence or presence, of systemic immunization. The top row illustrates TK, GFAP, and the merging of both images as indicated. The vast majority of the TK-immunoreactive cells were also GFAP+ (i.e., >85%). Some of the cells expressing both markers are indicated by white arrows on all three panels (all the TK-immunoreactive cells illustrated in these panels also expressed GFAP). The bottom row shows the same field, but colocalization was studied between TK and NeuN; no colocalization was detected. This indicates that the virus used expresses its marker gene almost exclusively within astrocytes, but not neurons. Bar, 100 μm. (B) Systemic immunization induces an immune response that clears virally infected expressing astrocytes and viral genomes from the brain. Panels a–e illustrate that after the systemic immunization against adenovirus, the adaptive immune response clears virally infected cells from the striatum. Analysis of brain sections from immunized animals (c, low power, and d, high power) show a reduction in the expression of the virally encoded marker gene, TK, when compared with naive animals (a and b). The decrease in the number of infected cells after immunization was assessed by quantifying adenovirally infected, TK-expressing cells (e), and the decrease in the number of viral genomes was quantified using quantitative real-time TaqMan PCR (f). Decreases in the number of infected cells (e), and adenoviral genomes (f), after the systemic immunization against adenovirus was statistically significant (*, P < 0.05; Student's t test). This indicates that the systemic immune response clears transduced astrocytes and viral genomes from the brain. Bars, 1 mm. (C) Adenovirally infected astrocytes express MHC-I. These panels illustrate a GFAP-immunoreactive astrocyte that has been infected with adenovirus and thus is immunopositive for the marker protein TK, expressing MHC-I. Bar, 40 μm.
Figure 2.
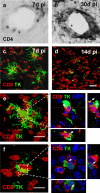
Anatomical localization of brain CD4+ and CD8+ T cells during the clearing of virally infected cells. CD4+ T cells within the brain remained immediately adjacent to brain blood vessels in the striatum (a and b), whereas CD8+ T cells (red) infiltrated the brain parenchyma proper (c and d). Time course studies (see Fig. 3) indicated that peak brain numbers of T cells were reached at 30 d for CD4+ T cells (b), and at 14 d for CD8+ T cells (d). Panels e and f illustrate that brain-infiltrating CD8+ T cells (red) within the rat striatum 7 and 14 d after immunization concentrate within the immediate vicinity of virally infected cells (i.e., TK-expressing cells [green]). Bars, 100 μm. CD8+ T cells establish close intercellular contacts with virally infected cells. CD8+ T cells were found surrounding virally infected (TK expressing) brain cells establishing multiple close contacts with them, especially at 14 d after immunization. Here, we illustrate two examples taken at 14 d after immunization. e and f represent confocal images throughout the thickness of the brain sections. Boxed areas in e and f are shown magnified to the right, but only a single 0.5-μm-thick optical section through the stacks shown in e and f is shown to demonstrate the close anatomical apposition between both cell types; xz and yz side views are illustrated too. White arrows indicate areas of close anatomical apposition of CD8+ T cells and infected no or very few brain cells. No or very few brain parenchyma–infiltrating T cells were detected in the hemisphere not infected with adenovirus or in the brains of injected animals that had not been immunized. Bar, 25 μm.
Figure 3.
CD4+ and CD8+ T cells are necessary for viral clearance from the brain. (A) CD4+ T cells are necessary for clearance of virally infected cells from the brain parenchyma. There was no loss of virally infected cells in animals in which CD4+ T cells had been depleted during the systemic immunization against adenovirus (panel a; CD4+ T cells depleted rats: immunized + CD4-depleting monoclonal antibody OX34. Control nondepleted rats: immunized animals + control nonimmune antibody isotype). A peak in the number of CD4+ T cells within the striatum was detected at 30 d after immunization in nondepleted immunized animals, but not in immunized rats depleted of CD4+ T cells (b). As shown in Fig. 2, CD4+ T cells remained close to brain blood vessels. *, P < 0.05 compared with nondepleted controls (nonparametric Kruskal-Wallis). (B) CD8+ T cells are necessary for clearance of virally infected cells from the brain parenchyma. No loss of virally infected cells could be detected in animals in which CD8+ T cells had been depleted during the systemic immunization against adenovirus (a; CD8+ T cell–depleted rats: immunized + CD8-depleting monoclonal antibody OX8. Control nondepleted rats: immunized animals + control nonimmune antibody isotype). A peak in the number of CD8+ T cells entering the brain parenchyma was detected at 14 d after immunization in nondepleted immunized animals, but not in immunized rats depleted of CD8+ T cells (b). As shown in Fig. 2, CD8+ T cells enter in the brain parenchyma proper and establish close appositions with virally infected cells. *, P < 0.05 compared with nondepleted controls (nonparametric Kruskal-Wallis). Rats that were injected with adenovirus in the brain, but were neither immunized nor injected with antibodies, were used as further controls and are illustrated in B. Notice that levels of infected, TK-immunoreactive cells in these animals did not differ from T cell–depleted rats (a).
Figure 4.
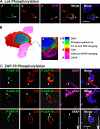
Polarized expression of p-Lck and p-ZAP-70 in CD8+ T cells tightly apposed to astrocytes during clearance of virally infected cells from the brain. Animals were infected unilaterally in the striatum with an adenovirus, and 30 d later they were immunized against adenovirus systemically. The systemic immunization induces a selective infiltration of CD8+ T cells into the injected, but not contralateral, hemisphere, which eventually clears infected astrocytes and viral genomes. All images shown represent 0.5-μm-thick confocal optical sections. Panels in A illustrate an activated lymphocyte in close anatomical apposition of the process of an astrocyte. Activation was established by p-Lck (green) immunoreactivity (a) within CD8+ (red) lymphocytes (b). Only CD8+ T cells that contacted astrocytes directly (GFAP+ processes) were immunoreactive for p-Lck, indicating the selective activation of T cells (a and b). White arrows indicate that the CD8+ T cell is contacting a GFAP-immunoreactive process (magenta) (c and merged images). DAPI nuclear staining (blue) was used as a cellular counterstain. Minimal T cells were observed within the noninjected hemisphere (not depicted). P-Lck within the CD8+ T cells was polarized to the T cell's membrane in close contact with the astrocyte's process (white arrow in merged images). B represents a three-dimensional reconstruction of the contact illustrated in A; the confocal image of the contact area is shown in a; b illustrates the color scales for A and B, including colors of areas of overlap between fluorophores. C illustrates the polarized expression of phosphorylated ZAP-70 in several CD8+ T cells during the clearance of infected GFAP+ astrocytes from the brain; p-ZAP-70 (green), CD8 (red), GFAP (magenta or white), and DAPI (nuclear marker in blue). Note that ZAP-70 is polarized to the site of contact between the CD8+ T cell and the astrocytes' processes. Bars, 15 μm.
Figure 5.
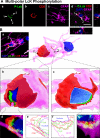
Multiple sites of polarized accumulation of p-Lck in a CD8+ T cell establishing several contacts with a target astrocyte. (A) Confocal images of a CD8+ T cell that displays three areas of close membrane apposition to an astrocyte. (a–c) A stack of sections representing approximately a total of 20 μm. (a) The immunoreactivity of the CD8+ T cell for p-Lck indicating three areas of p-Lck polarization (white arrows 1, 2, and 3 in a). b illustrates CD8-immunoreactivity and c shows the immunoreactivity of the target astrocyte for GFAP. The merged image (d) represents a single 0.5-μm optical section in which all three individual channels shown in a–c have been merged, with the associated xz and yz lateral views, to illustrate two intercellular contacts that are indicated by the white arrows labeled 1 and 2. Bar, 25 μm (B) The three-dimensional reconstruction, in detail, of the immunological synapses shown in A. (a) The merged image of the three individual stacks shown individually in A. Panel a has been rotated ∼35° to the left to clarify the view of two of the close appositions; these have been reconstructed in three dimensions and are shown at higher magnification in b–g. Within the three-dimensional reconstruction, the location of two close contacts is indicated by the broken circles 1 and 2. Close contact 1 is shown in b, d, and e in more detail. Panel b is the contact 1 of the three-dimensional reconstruction, from which a slice of the image has been removed to demonstrate the polarization of p-Lck (green) to the area of close apposition between both cells. Notice how the CD8+ T cell appears to engulf the GFAP process (magenta). An enlarged confocal image of the close contact is illustrated in d, whereas e is a contour map of each of the immunoreactivities illustrated in d. Panels c, f, and g illustrate the same analysis for contact number 2. Notice how the CD8+ T cell appears to form protrusions into the GFAP process of the astrocyte (magenta) (c, f, and g).
Figure 6.
Homogenous distribution of LFA-1 and TCR immunoreactivity along the plasma membrane of T cells not in contact with infected target cells. LFA-1 and TCR show homogeneous distribution along the plasma membrane of T cells neither in close apposition of target infected cells, nor involved in the formation of immunological synapses. Top panels (A–E) show a LFA-1 positive cell (B) not in contact with a TK-immunoreactive process (D), showing a uniform distribution of LFA-1. Panels F-J show a T cell with no LFA-1 expression (G) with a homogeneous distribution of TCR (H). Panels K-O show a T cell expressing LFA-1 (L) and TCR (M) not contacting a TK positive cell (N) showing no specific polarization and distribution in clusters. Panels P–T illustrate a CD8+ T cell expressing LFA-1 in a nonpolarized fashion in a cell that does not contact any infected cell. Bar, 25 μm.
Figure 7.
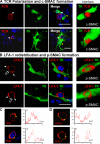
Formation of c-SMAC and p-SMAC in vivo. TCR polarization and clustering within c-SMAC (A) and LFA-1 distribution to the p-SMAC (B). TCR staining is polarized to membrane areas displaying close contacts between T cells and infected brain cells, and clusters at sites where immunological synapses form (two different immunological synapses are shown in A and C). Three-dimensional reconstructions allow visualization of the formation of c-SMAC at the interface of lymphocytes and infected cells (A, under “Interface”); the quantification of the clustering of the TCR at the c-SMAC of the immunological synapses shownin A is illustrated in C (yellow arrow and intensity graph). LFA-1 forms a ring (p-SMAC) that surrounds c-SMAC, but is reduced within c-SMAC itself (two different immunological synapses are shown in B and D). Three-dimensional reconstructions show the LFA-1 immunoreactive p-SMAC ring at the interface between the T cells and target infected brain cells (B, under “Interface”); the quantification of the distribution of LFA-1 immunoreactivity at the p-SMAC of immunological synapses shown in B is illustrated in D (yellow arrow and intensity graph). Bars, 25 μm.
Figure 8.
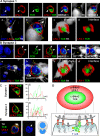
SMAC formation at immunological synapses in vivo, between T cells and infected astrocytes in the brain. Two mature immunological synapses displaying typical and characteristic SMAC formations, are shown in A and B. The row of upper panels in A and B illustrate images captured in the given channels, from left to right: DAPI (blue), LFA-1 (red), TCR (green), LFA1+TCR, LFA1+TCR+DAPI (MERGE 1), the virally infected cell (TK; in white), and LFA1+TCR+DAPI+TK (MERGE 2). Notice that these mature immunological synapses are characterized by the specific distribution of LFA-1 and TCR contacting the virally infected cell. In the views shown in the top panels (side views of the immunological synapses), LFA-1 immunoreactivity displays high relative fluorescence density within areas of the membrane lateral to the close apposition of membranes of the lymphocyte with the infected cell, thus displaying the typical central region of lower density (see arrows in red channel) at the site of highest density of immunoreactivity for TCR (see arrows in the green channel and in the MERGE 1 and 2 images). The yellow asterisk indicates, in the white channel, the anatomical location of the T cell. The row of bottom panels in A and B illustrate, respectively, low (a) and high (b) magnifications of the close apposition between the T cell and the infected cell. These images were reconstructed using three-dimensional visualization software to illustrate the characteristic structure of the p-SMAC (LFA-1 ring) and c-SMAC (TCR cluster) at the interface of the immunological synapses seen in en face views (c and d). To produce the three-dimensional image of the interface shown in c and d, the three-dimensional reconstruction was rotated so that the plane of the interface of the immunological synapse (b, broken arrow) could be observed from above (white arrow in b shows the angle of vision of c and d). At the interface, typical “bull's eye” structures, characteristic of p-SMAC (LFA-1 outer ring) and c-SMAC (central TCR cluster) can be clearly recognized (c and d). In C, the intensity of fluorescence (I) was measured at the interface (yellow line) of the immunological synapse in a 0.5-μm confocal layer taken through the interface. The small graphs to the right of each synapse show the relative intensity values of fluorescence of LFA-1 (in red) and TCR (in green). Note the maximum of intensity for LFA-1 was in the periphery of the synapse (p-SMAC), whereas the TCR is clustered toward the center (c-SMAC). (D) A diagrammatic view of a T cell contacting an antigen-expressing astrocyte illustrating the localization of molecules involved in the immunological synapse and the polarization and phosphorylation of key tyrosine kinases. (E) A characteristic activated T cell nucleus displaying the polarized arched conformation opening toward the immunological synaptic interface. Bars, 15 μm.
Figure 9.
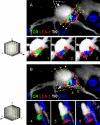
Criteria used in the selection of optical planes from three-dimensional reconstructions of mature immunological synapses, for the illustration of SMAC formation in vivo. 90° rotations of three-dimensional reconstructions were made to observe the xz optical planes 1, 2, and 3 through axis y. Images A1, A2, and A3 show xz optical planes from image A. The immunological synaptic interface seen in optical plane xz (1) is illustrated in A1; this optical plane was selected as the one in which the T cell's nucleus could not be visualized. Optical planes 2 and 3 (illustrated in A2 and A3) show the T cell's nucleus, demonstrating that these optical planes are at a distance from the synaptic interface and thus do not allow observation of the SMAC. Note that the optical plane 1 is the only one that shows the SMAC. yz optical planes 4, 5, and 6 were obtained from a 90° rotation of image B through the x axis. In plane 5 (illustrated in A5) the TCR is closely apposed to the infected cell without any intervening LFA-1; this plane is taken through the center of the c-SMAC. In images of planes 4 and 6 (illustrated in A4 and A6) LFA-1 immunoreactivity, rather than TCR, is in close apposition of the infected cell, indicating that these planes are taken through the p-SMAC. Note that this detailed three-dimensional reconstruction analysis was performed on the synapse illustrated in Fig. 8 A.
Figure 10.
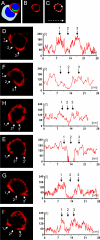
Quantitative distribution of LFA-1 through the plasma membrane of T cells involved in formation of mature immunological synapses. The relative fluorescence of LFA-1 was measured in six T cells forming mature immunological synapses contacting virally infected cells (A). The red LFA-1 channel was selected [B] and the complete distribution of LFA-1 throughout the extent of the plasma membrane was delineated measuring the intensity of fluorescence in a linear graph (illustrated schematically in C). Panels D–I show the quantification of LFA-1 in six different cells forming mature immunological synapses. Small white arrows ‘1’ and ‘3’ indicate the p-SMAC and arrow ‘2’ the c-SMAC. Note that the level of LFA-1 is reduced (or absent) within the c-SMAC of all cells. Further LFA-1 levels are increased in the p-SMAC in some cells (illustrated in D, G, and I), while it does not increase in the p-SMAC of others [F, H, E]. Note that for clarity the target virally infected cells, found in apposition of the immunological synapses illustrated, are not shown; synapses shown in (D) and (E) are illustrated in further detail in Fig. 7, and synapse (F) in Fig. 8 A. Synapses H, G, and I are not illustrated further.
Similar articles
- In vivo polarization of IFN-gamma at Kupfer and non-Kupfer immunological synapses during the clearance of virally infected brain cells.
Barcia C, Wawrowsky K, Barrett RJ, Liu C, Castro MG, Lowenstein PR. Barcia C, et al. J Immunol. 2008 Feb 1;180(3):1344-52. doi: 10.4049/jimmunol.180.3.1344. J Immunol. 2008. PMID: 18209028 Free PMC article. - T cells' immunological synapses induce polarization of brain astrocytes in vivo and in vitro: a novel astrocyte response mechanism to cellular injury.
Barcia C, Sanderson NS, Barrett RJ, Wawrowsky K, Kroeger KM, Puntel M, Liu C, Castro MG, Lowenstein PR. Barcia C, et al. PLoS One. 2008 Aug 20;3(8):e2977. doi: 10.1371/journal.pone.0002977. PLoS One. 2008. PMID: 18714338 Free PMC article. - HIV Envelope gp120 Alters T Cell Receptor Mobilization in the Immunological Synapse of Uninfected CD4 T Cells and Augments T Cell Activation.
Deng J, Mitsuki YY, Shen G, Ray JC, Cicala C, Arthos J, Dustin ML, Hioe CE. Deng J, et al. J Virol. 2016 Nov 14;90(23):10513-10526. doi: 10.1128/JVI.01532-16. Print 2016 Dec 1. J Virol. 2016. PMID: 27630246 Free PMC article. - Kupfer-type immunological synapses in vivo: Raison D'être of SMAC.
Mitxitorena I, Saavedra E, Barcia C. Mitxitorena I, et al. Immunol Cell Biol. 2015 Jan;93(1):51-6. doi: 10.1038/icb.2014.80. Epub 2014 Sep 30. Immunol Cell Biol. 2015. PMID: 25267483 Review. - Two receptors, two kinases, and T cell lineage determination.
Alarcón B, van Santen HM. Alarcón B, et al. Sci Signal. 2010 Mar 23;3(114):pe11. doi: 10.1126/scisignal.3114pe11. Sci Signal. 2010. PMID: 20332426 Review.
Cited by
- Cerebrospinal fluid (CSF) CD8+ T-cells that express interferon-gamma contribute to HIV associated neurocognitive disorders (HAND).
Schrier RD, Hong S, Crescini M, Ellis R, Pérez-Santiago J, Spina C, Letendre S; HNRP Group. Schrier RD, et al. PLoS One. 2015 Feb 26;10(2):e0116526. doi: 10.1371/journal.pone.0116526. eCollection 2015. PLoS One. 2015. PMID: 25719800 Free PMC article. - The synapse and cytolytic machinery of cytotoxic T cells.
Jenkins MR, Griffiths GM. Jenkins MR, et al. Curr Opin Immunol. 2010 Jun;22(3):308-13. doi: 10.1016/j.coi.2010.02.008. Epub 2010 Mar 11. Curr Opin Immunol. 2010. PMID: 20226643 Free PMC article. Review. - Immunization against the transgene but not the TetON switch reduces expression from gutless adenoviral vectors in the brain.
Xiong W, Candolfi M, Kroeger KM, Puntel M, Mondkar S, Larocque D, Liu C, Curtin JF, Palmer D, Ng P, Lowenstein PR, Castro MG. Xiong W, et al. Mol Ther. 2008 Feb;16(2):343-51. doi: 10.1038/sj.mt.6300375. Epub 2008 Jan 8. Mol Ther. 2008. PMID: 18180781 Free PMC article. - CNS-infiltrating CD4+ T lymphocytes contribute to murine spinal nerve transection-induced neuropathic pain.
Cao L, DeLeo JA. Cao L, et al. Eur J Immunol. 2008 Feb;38(2):448-58. doi: 10.1002/eji.200737485. Eur J Immunol. 2008. PMID: 18196515 Free PMC article. - Identification and visualization of CD8+ T cell mediated IFN-γ signaling in target cells during an antiviral immune response in the brain.
Puntel M, Barrett R, Sanderson NS, Kroeger KM, Bondale N, Wibowo M, Kennedy S, Liu C, Castro MG, Lowenstein PR. Puntel M, et al. PLoS One. 2011;6(8):e23523. doi: 10.1371/journal.pone.0023523. Epub 2011 Aug 29. PLoS One. 2011. PMID: 21897844 Free PMC article.
References
- Dustin, M.L. 2005. A dynamic view of the immunological synapse. Semin. Immunol. 17:400–410. - PubMed
- Friedl, P., A.T. den Boer, and M. Gunzer. 2005. Tuning immune responses: diversity and adaptation of the immunological synapse. Nat. Rev. Immunol. 5:532–545. - PubMed
- Grakoui, A., S.K. Bromley, C. Sumen, M.M. Davis, A.S. Shaw, P.M. Allen, and M.L. Dustin. 1999. The immunological synapse: a molecular machine controlling T cell activation. Science. 285:221–227. - PubMed
- Huppa, J.B., and M.M. Davis. 2003. T-cell-antigen recognition and the immunological synapse. Nat. Rev. Immunol. 3:973–983. - PubMed
Publication types
MeSH terms
Substances
Grants and funding
- U54 NS045309-010005/NS/NINDS NIH HHS/United States
- U54 NS045309-01/NS/NINDS NIH HHS/United States
- R01 NS042893-01A1/NS/NINDS NIH HHS/United States
- 1 R01 NS 42893.01/NS/NINDS NIH HHS/United States
- R21 NS047298/NS/NINDS NIH HHS/United States
- R01 NS044556/NS/NINDS NIH HHS/United States
- 1R01 NS44556.01/NS/NINDS NIH HHS/United States
- U54 NS045309/NS/NINDS NIH HHS/United States
- R01 NS044556-01/NS/NINDS NIH HHS/United States
- 1 R03 TW006273-01/TW/FIC NIH HHS/United States
- R01 NS042893/NS/NINDS NIH HHS/United States
- R03 TW006273-01A1/TW/FIC NIH HHS/United States
- 1R21 NS047298-01/NS/NINDS NIH HHS/United States
- R03 TW006273/TW/FIC NIH HHS/United States
- R21 NS047298-01/NS/NINDS NIH HHS/United States
LinkOut - more resources
Full Text Sources
Other Literature Sources
Research Materials
Miscellaneous

