Assessment of whole genome amplification-induced bias through high-throughput, massively parallel whole genome sequencing - PubMed (original) (raw)
Comparative Study
Assessment of whole genome amplification-induced bias through high-throughput, massively parallel whole genome sequencing
Robert Pinard et al. BMC Genomics. 2006.
Abstract
Background: Whole genome amplification is an increasingly common technique through which minute amounts of DNA can be multiplied to generate quantities suitable for genetic testing and analysis. Questions of amplification-induced error and template bias generated by these methods have previously been addressed through either small scale (SNPs) or large scale (CGH array, FISH) methodologies. Here we utilized whole genome sequencing to assess amplification-induced bias in both coding and non-coding regions of two bacterial genomes. Halobacterium species NRC-1 DNA and Campylobacter jejuni were amplified by several common, commercially available protocols: multiple displacement amplification, primer extension pre-amplification and degenerate oligonucleotide primed PCR. The amplification-induced bias of each method was assessed by sequencing both genomes in their entirety using the 454 Sequencing System technology and comparing the results with those obtained from unamplified controls.
Results: All amplification methodologies induced statistically significant bias relative to the unamplified control. For the Halobacterium species NRC-1 genome, assessed at 100 base resolution, the D-statistics from GenomiPhi-amplified material were 119 times greater than those from unamplified material, 164.0 times greater for Repli-G, 165.0 times greater for PEP-PCR and 252.0 times greater than the unamplified controls for DOP-PCR. For Campylobacter jejuni, also analyzed at 100 base resolution, the D-statistics from GenomiPhi-amplified material were 15 times greater than those from unamplified material, 19.8 times greater for Repli-G, 61.8 times greater for PEP-PCR and 220.5 times greater than the unamplified controls for DOP-PCR.
Conclusion: Of the amplification methodologies examined in this paper, the multiple displacement amplification products generated the least bias, and produced significantly higher yields of amplified DNA.
Figures
Figure 1
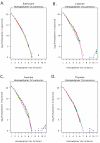
A – D: Hompolymer coverage in Halobacterium sequence reads. A. A log2plot illustrating the total number of adenosine homopolymers sequenced in reads generated by control and amplified populations of Halobacterium species NRC-1 DNA. The data from the unamplified replicate population are shown in red, GenomiPhi in blue, Repli-G in orange, PEP in green and DOP in purple. B. As Figure 1A., but for Cytosine homopolymers. C. As Figure 1A., but for Guanine homopolymers. D. As Figure 1A., but for Thymine homopolymers.
Figure 2
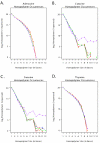
A – D: Hompolymer coverage in Campylobacter jejuni sequence reads. A. A log2 plot illustrating the total number of adenosine homopolymers sequenced in reads generated by control and amplified populations of Campylobacter jejuni DNA. The data from the unamplified replicate population are shown in red, GenomiPhi in blue, Repli-G in orange, PEP in green and DOP in purple. B. As Figure 2A., but for Cytosine homopolymers. C. As Figure 2A., but for Guanine homopolymers. D. As Figure 2A., but for Thymine homopolymers.
Figure 3
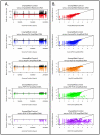
A & B: Comparison of control sequence coverage versus repeat region location. Distribution of sequence coverage from unamplified control Halobacterium species NRC-1 population as determined by sequence based karyotyping at 100 base resolution relative to repeat region and chromosome location. A. Counts per bin are displayed above the X axis in red, repeat regions are shown below the X axis in black. The X axis displays the length of the genome in bases. The relative location of the three Halobacterium chromosomes are shown by the horizontal bars below the X axis, NRC1 is green, pNRC100 is gold, and pNRC200 is purple. B. As for Figure 3A, but for Campylobacter jejuni. No chromosome bars are included as C. jejuni is comprised of a single chromosome.
Figure 4
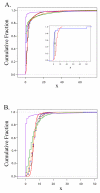
A & B: Empirical cumulative distribution functions. A. Empirical cumulative distribution function (ECDF) depicting the distributions of counts per bin for various control and amplified populations of Halobacterium species NRC-1 DNA. The ECDF represents the cumulative distribution of the number of counts per bin, reporting the cumulative proportion of bins with counts equal or less than the value on the X axis. The control cumulative fraction (black) is plotted against all WGA approaches; GenomiPhi in blue, Repli-G in orange, PEP in green and DOP in purple. Inset. Generic ECDF of two different distributions (red and blue), the D statistic is shown as black vertical line labelled "D". B as Figure 4A, but derived from Campylobacter jejuni.
Figure 5
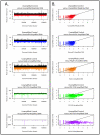
A & B: Comparison of Halobacterium sequence coverage. Distribution of sequence coverage from unamplified reference, unamplified replicate and whole genome amplified Halobacterium species NRC-1 populations as determined by sequence based karyotyping at 100 base resolution. A. Distribution of the counts per bin (y-axis) across the length of the genome (X axis) of test populations relative to the unamplified reference population. The counts per bin from the unamplified reference population are depicted in black above the X axis, counts from the various test populations are inverted and shown below the X axis. The data from the unamplified replicate population is shown in red, GenomiPhi in blue, Repli-G in orange, PEP in green and DOP in purple. B. Log-log plot of the counts per bin from the unamplified reference population versus the various test populations. The comparison between the reference and the unamplified replicate population is shown in red, GenomiPhi in blue, Repli-G in orange, PEP in green and DOP in purple. A 45 degree black line is shown for comparison.
Figure 6
A & B: Comparison of Campylobacter sequence coverage. Distribution of sequence coverage from unamplified reference, unamplified replicate and whole genome amplified Campylobacter jejuni populations as determined by sequence based karyotyping at 100 base resolution. A. Distribution of the counts per bin (y-axis) across the length of the genome (X axis) of test populations relative to the unamplified reference population. The counts per bin from the unamplified reference population are depicted in black above the X axis, counts from the various test populations are inverted and shown below the X axis. The data from the unamplified replicate population is shown in red, GenomiPhi in blue, Repli-G in orange, PEP in green and DOP in purple. B. Log-log plot of the counts per bin from the unamplified reference population versus the various test populations. The comparison between the reference and the unamplified replicate population is shown in red, GenomiPhi in blue, Repli-G in orange, PEP in green and DOP in purple. A 45 degree black line is shown for comparison.
Similar articles
- Assessment of REPLI-g Multiple Displacement Whole Genome Amplification (WGA) Techniques for Metagenomic Applications.
Ahsanuddin S, Afshinnekoo E, Gandara J, Hakyemezoğlu M, Bezdan D, Minot S, Greenfield N, Mason CE. Ahsanuddin S, et al. J Biomol Tech. 2017 Apr;28(1):46-55. doi: 10.7171/jbt.17-2801-008. Epub 2017 Mar 21. J Biomol Tech. 2017. PMID: 28344519 Free PMC article. - Characterization of whole genome amplified (WGA) DNA for use in genotyping assay development.
Han T, Chang CW, Kwekel JC, Chen Y, Ge Y, Martinez-Murillo F, Roscoe D, Težak Z, Philip R, Bijwaard K, Fuscoe JC. Han T, et al. BMC Genomics. 2012 Jun 1;13:217. doi: 10.1186/1471-2164-13-217. BMC Genomics. 2012. PMID: 22655855 Free PMC article. - Evaluation of Phi29-based whole-genome amplification for microarray-based comparative genomic hybridisation.
Arriola E, Lambros MB, Jones C, Dexter T, Mackay A, Tan DS, Tamber N, Fenwick K, Ashworth A, Dowsett M, Reis-Filho JS. Arriola E, et al. Lab Invest. 2007 Jan;87(1):75-83. doi: 10.1038/labinvest.3700495. Lab Invest. 2007. PMID: 17170740 - Bias in Whole Genome Amplification: Causes and Considerations.
Sabina J, Leamon JH. Sabina J, et al. Methods Mol Biol. 2015;1347:15-41. doi: 10.1007/978-1-4939-2990-0_2. Methods Mol Biol. 2015. PMID: 26374307 Review. - [Comparison of different single cell whole genome amplification methods and MALBAC applications in assisted reproduction].
Yao YX, La YF, Di R, Liu QY, Hu WP, Wang XY, Chu MX. Yao YX, et al. Yi Chuan. 2018 Aug 16;40(8):620-631. doi: 10.16288/j.yczz.18-091. Yi Chuan. 2018. PMID: 30117418 Review. Chinese.
Cited by
- Mosquito-borne heartworm Dirofilaria immitis in dogs from Australia.
Nguyen C, Koh WL, Casteriano A, Beijerink N, Godfrey C, Brown G, Emery D, Šlapeta J. Nguyen C, et al. Parasit Vectors. 2016 Oct 7;9(1):535. doi: 10.1186/s13071-016-1821-x. Parasit Vectors. 2016. PMID: 27717406 Free PMC article. - Nanoliter reactors improve multiple displacement amplification of genomes from single cells.
Marcy Y, Ishoey T, Lasken RS, Stockwell TB, Walenz BP, Halpern AL, Beeson KY, Goldberg SM, Quake SR. Marcy Y, et al. PLoS Genet. 2007 Sep;3(9):1702-8. doi: 10.1371/journal.pgen.0030155. PLoS Genet. 2007. PMID: 17892324 Free PMC article. - Population Structure and Dynamics of Helminthic Infection: Schistosomiasis.
Blanton RE. Blanton RE. Microbiol Spectr. 2019 Jul;7(4):10.1128/microbiolspec.ame-0009-2019. doi: 10.1128/microbiolspec.AME-0009-2019. Microbiol Spectr. 2019. PMID: 31325285 Free PMC article. Review. - Assessment of REPLI-g Multiple Displacement Whole Genome Amplification (WGA) Techniques for Metagenomic Applications.
Ahsanuddin S, Afshinnekoo E, Gandara J, Hakyemezoğlu M, Bezdan D, Minot S, Greenfield N, Mason CE. Ahsanuddin S, et al. J Biomol Tech. 2017 Apr;28(1):46-55. doi: 10.7171/jbt.17-2801-008. Epub 2017 Mar 21. J Biomol Tech. 2017. PMID: 28344519 Free PMC article. - Independent mitochondrial and nuclear exchanges arising in Rhizophagus irregularis crossed-isolates support the presence of a mitochondrial segregation mechanism.
Daubois L, Beaudet D, Hijri M, de la Providencia I. Daubois L, et al. BMC Microbiol. 2016 Jan 23;16:11. doi: 10.1186/s12866-016-0627-5. BMC Microbiol. 2016. PMID: 26803293 Free PMC article.
References
- Andries K, Verhasselt P, Guillemont J, Gohlmann HW, Neefs JM, Winkler H, Van Gestel J, Timmerman P, Zhu M, Lee E, Williams P, de Chaffoy D, Huitric E, Hoffner S, Cambau E, Truffot-Pernot C, Lounis N, Jarlier V. A diarylquinoline drug active on the ATP synthase of Mycobacterium tuberculosis. Science. 2005;307:223–227. doi: 10.1126/science.1106753. - DOI - PubMed
- Zheng S, Ma X, Buffler PA, Smith MT, Wiencke JK. Whole genome amplification increases the efficiency and validity of buccal cell genotyping in pediatric populations. Cancer Epidemiol Biomarkers Prev. 2001;10:697–700. - PubMed
Publication types
MeSH terms
Substances
LinkOut - more resources
Full Text Sources
Other Literature Sources
Miscellaneous
