Atomic resolution structures in nuclear transport - PubMed (original) (raw)
Atomic resolution structures in nuclear transport
Katherine E Süel et al. Methods. 2006 Aug.
Abstract
There are currently at least 53 structures of components of nuclear transport in the Protein Databank. In addition to providing critical insights into molecular mechanisms of nuclear transport, these atomic resolution structures provide a large body of information that could guide biochemical and cell biological analyses involving nuclear transport proteins. This paper catalogs 53 crystal and NMR structures of nuclear transport proteins, with the emphasis on providing information useful for mutagenesis and overexpression of recombinant proteins.
Figures
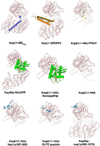
Fig. 1
Structures of Kapβ1/Impβ complexes. Kapβ1 proteins are shown as red ribbons. Substrates IBB (blue) and SREBP2 (orange) are drawn as cylinders and ribbons, PTHrp as a yellow ribbon. Ran is shown in green and nucleoporin peptides in blue (Nsp1p and the GLFG peptide drawn as stick figure and nup1p as cylinder/ribbon). (For interpretation of the references to color in this figure legend, the reader is referred to the web version of this paper.)
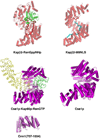
Fig. 2
Structures of Kapβ2/Transportin complexes, Cse1p complexes and a Crm1 fragment. In the two Kapβ2 complexes, both Kapβ2 (red) and Ran (green) are shown as cylinders/ribbons and substrate M9NLS is shown as a cyan ribbon. Cse1p and Crm1 are both shown as purple cylinders/ribbons, and Ran (green) and Kapα (yellow) in the Cse1p-Ran-Kapα complex as ribbons. (For interpretation of the references to color in this figure legend, the reader is referred to the web version of this paper.)
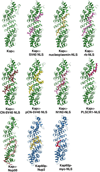
Fig. 3
Structures of mouse Kapα and yeast Kap60p complexes. Mouse Kapαs are all drawn as green ribbons and yeast Kap60p as blue ribbons. With the exception of Nup50p (red ribbon), all other ligands are shown as stick figures. (For interpretation of the references to color in this figure legend, the reader is referred to the web version of this paper.)
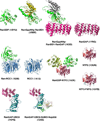
Fig. 4
Structures of complexes involving Ran, NTF2, RanGAP and RanGEF. All 11 structures are shown as ribbon diagrams, with Ran in green, RanGAP in magenta, RCC1 RanGEF in blue, NTF2 in red, and RanBD1 or RanBP1-domain in gold (RanGppNHp-RBD1; 1RRP) and grey (RanGppNHp-RanBD1-RanGAP; 1K5D). RanGAP ligands, UBC9 is in aquamarine, SUMO is light brown and a fragment of Nup358 is in light green.
Fig. 5
Structures of mRNA export factor TAP. TAP, Mex67p, p15 and MTR2p are all drawn as ribbons, and FG nucleoporin peptides are shown as stick figures. Domains of TAP and its yeast homolog Mex67p are in purple, p15 and its homolog Mtr2p are in red, and nucleoporin peptides in light green. (For interpretation of the references to color in this figure legend, the reader is referred to the web version of this paper.)
Fig. 6
Structures of nucleoporin domains.
Similar articles
- Karyopherins: from nuclear-transport mediators to nuclear-function regulators.
Mosammaparast N, Pemberton LF. Mosammaparast N, et al. Trends Cell Biol. 2004 Oct;14(10):547-56. doi: 10.1016/j.tcb.2004.09.004. Trends Cell Biol. 2004. PMID: 15450977 Review. - A 2.1-Å-resolution crystal structure of unliganded CRM1 reveals the mechanism of autoinhibition.
Saito N, Matsuura Y. Saito N, et al. J Mol Biol. 2013 Jan 23;425(2):350-64. doi: 10.1016/j.jmb.2012.11.014. Epub 2012 Nov 16. J Mol Biol. 2013. PMID: 23164569 - Structural biology. Nuclear trafficking.
Stewart M. Stewart M. Science. 2003 Nov 28;302(5650):1513-4. doi: 10.1126/science.1092863. Science. 2003. PMID: 14645832 No abstract available. - [X-ray crystallography of a nuclear export complex].
Matsuura Y. Matsuura Y. Tanpakushitsu Kakusan Koso. 2005 May;50(5):420-6. Tanpakushitsu Kakusan Koso. 2005. PMID: 15875545 Review. Japanese. No abstract available.
Cited by
- Conformational selection in the recognition of the snurportin importin beta binding domain by importin beta.
Bhardwaj A, Cingolani G. Bhardwaj A, et al. Biochemistry. 2010 Jun 22;49(24):5042-7. doi: 10.1021/bi100292y. Biochemistry. 2010. PMID: 20476751 Free PMC article. - Structural basis for leucine-rich nuclear export signal recognition by CRM1.
Dong X, Biswas A, Süel KE, Jackson LK, Martinez R, Gu H, Chook YM. Dong X, et al. Nature. 2009 Apr 30;458(7242):1136-41. doi: 10.1038/nature07975. Epub 2009 Apr 1. Nature. 2009. PMID: 19339969 Free PMC article. - Structural and energetic basis of ALS-causing mutations in the atypical proline-tyrosine nuclear localization signal of the Fused in Sarcoma protein (FUS).
Zhang ZC, Chook YM. Zhang ZC, et al. Proc Natl Acad Sci U S A. 2012 Jul 24;109(30):12017-21. doi: 10.1073/pnas.1207247109. Epub 2012 Jul 9. Proc Natl Acad Sci U S A. 2012. PMID: 22778397 Free PMC article. - The importin beta binding domain modulates the avidity of importin beta for the nuclear pore complex.
Lott K, Bhardwaj A, Mitrousis G, Pante N, Cingolani G. Lott K, et al. J Biol Chem. 2010 Apr 30;285(18):13769-80. doi: 10.1074/jbc.M109.095760. Epub 2010 Mar 1. J Biol Chem. 2010. PMID: 20197273 Free PMC article. - Nuclear import by karyopherin-βs: recognition and inhibition.
Chook YM, Süel KE. Chook YM, et al. Biochim Biophys Acta. 2011 Sep;1813(9):1593-606. doi: 10.1016/j.bbamcr.2010.10.014. Epub 2010 Oct 26. Biochim Biophys Acta. 2011. PMID: 21029754 Free PMC article. Review.
References
- Lee SJ, Matsuura Y, Liu SM, Stewart M. Nature. 2005;435:693–696. - PubMed
- Vetter IR, Arndt A, Kutay U, Gorlich D, Wittinghofer A. Cell. 1999;97:635–646. - PubMed
- Lee SJ, Imamoto N, Sakai H, Nakagawa A, Kose S, Koike M, Yamamoto M, Kumasaka T, Yoneda Y, Tsukihara T. J. Mol. Biol. 2000;302:251–264. - PubMed
- Cingolani G, Petosa C, Weis K, Muller CW. Nature. 1999;399:221–229. - PubMed
- Koerner C, Guan T, Gerace L, Cingolani G. J. Biol. Chem. 2003;278:16216–16221. - PubMed
MeSH terms
Substances
LinkOut - more resources
Full Text Sources


