A new dimension of sensory dysfunction: stereopsis deficits in schizophrenia - PubMed (original) (raw)
A new dimension of sensory dysfunction: stereopsis deficits in schizophrenia
Isaac Schechter et al. Biol Psychiatry. 2006.
Abstract
Background: Schizophrenia is a neurocognitive disorder with a wide range of cognitive and sensory impairments. Early visual processing has been shown to be especially impaired. This article investigates the integrity of binocular depth perception (stereopsis) in schizophrenia.
Methods: Seventeen schizophrenia patients and 19 healthy control subjects were compared on the Graded Circles Stereo Test. Results of stereoacuity were compared between patients and control subjects using t test.
Results: Schizophrenia patients demonstrated significantly (p = .006) reduced stereoacuity (mean = 142 arcseconds) versus control subjects (mean = 55 arcseconds). At the normative level for adults, patients performed below chance.
Conclusions: These findings demonstrate an impairment of binocular depth perception and further confirm deficits of early visual processing in schizophrenia. Findings are discussed in context of magnocellular/dorsal stream processing with implications for visual processing and cognitive deficits.
Figures
Fig. 1
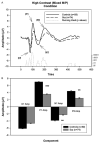
A. Graph showing the group average waveforms for the high contrast (mixed M/P) condition over time for controls and patients with running _t_-test. B. Bar graph showing group average C1, P1, N1 and P2 component amplitudes with SEM for patients and controls. **P<.005, ***P<.001
Fig. 2
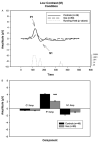
A. Graph showing the group average waveforms for the low contrast (M) condition over time for controls and patients with running _t_-test. B. Bar graph showing group average C1, P1, and N1 component amplitudes with SEM for patients and controls. ***P<.001
Fig. 3
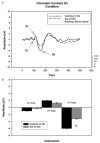
A. Graph showing the group average waveforms for the chromatic contrast (P) condition over time for controls and patients with running _t_-test. B. Bar graph showing group average C1, P1, and N1 component amplitudes with SEM for patients and controls. **P<.005.
Similar articles
- Stereopsis deficits in patients with schizophrenia in a Han Chinese population.
Hui L, Sen Xia H, Shu Tang A, Feng Zhou Y, Zhong Yin G, Long Hu X, Dong Du X, Tang Y. Hui L, et al. Sci Rep. 2017 Apr 12;7:45988. doi: 10.1038/srep45988. Sci Rep. 2017. PMID: 28401916 Free PMC article. - Subcortical visual dysfunction in schizophrenia drives secondary cortical impairments.
Butler PD, Martinez A, Foxe JJ, Kim D, Zemon V, Silipo G, Mahoney J, Shpaner M, Jalbrzikowski M, Javitt DC. Butler PD, et al. Brain. 2007 Feb;130(Pt 2):417-30. doi: 10.1093/brain/awl233. Epub 2006 Sep 19. Brain. 2007. PMID: 16984902 Free PMC article. - Stereopsis and magnocellular sensitivity in schizophrenia.
Skottun BC, Skoyles JR. Skottun BC, et al. World J Biol Psychiatry. 2009;10(4 Pt 3):697-701. doi: 10.1080/15622970701849945. World J Biol Psychiatry. 2009. PMID: 18609415 Review. - Binocular depth perception in individuals at clinical high risk for psychosis: no evidence of dysfunction.
Barbato M, Addington J. Barbato M, et al. Neuropsychology. 2014 May;28(3):366-72. doi: 10.1037/neu0000033. Epub 2013 Nov 4. Neuropsychology. 2014. PMID: 24188117 Free PMC article. - Stereopsis: are we assessing it in enough depth?
O'Connor AR, Tidbury LP. O'Connor AR, et al. Clin Exp Optom. 2018 Jul;101(4):485-494. doi: 10.1111/cxo.12655. Epub 2018 Jan 27. Clin Exp Optom. 2018. PMID: 29377291 Free PMC article. Review.
Cited by
- Effects of horizontal acceleration on human visual acuity and stereopsis.
Horng CT, Hsieh YS, Tsai ML, Chang WK, Yang TH, Yauan CH, Wang CH, Kuo WH, Wu YC. Horng CT, et al. Int J Environ Res Public Health. 2015 Jan 19;12(1):910-26. doi: 10.3390/ijerph120100910. Int J Environ Res Public Health. 2015. PMID: 25607601 Free PMC article. - N-methyl-d-aspartate (NMDA) receptor dysfunction or dysregulation: the final common pathway on the road to schizophrenia?
Kantrowitz JT, Javitt DC. Kantrowitz JT, et al. Brain Res Bull. 2010 Sep 30;83(3-4):108-21. doi: 10.1016/j.brainresbull.2010.04.006. Epub 2010 Apr 24. Brain Res Bull. 2010. PMID: 20417696 Free PMC article. Review. - Schizophrenia and the eye.
Silverstein SM, Rosen R. Silverstein SM, et al. Schizophr Res Cogn. 2015 Jun;2(2):46-55. doi: 10.1016/j.scog.2015.03.004. Schizophr Res Cogn. 2015. PMID: 26345525 Free PMC article. - Stereopsis deficits in patients with schizophrenia in a Han Chinese population.
Hui L, Sen Xia H, Shu Tang A, Feng Zhou Y, Zhong Yin G, Long Hu X, Dong Du X, Tang Y. Hui L, et al. Sci Rep. 2017 Apr 12;7:45988. doi: 10.1038/srep45988. Sci Rep. 2017. PMID: 28401916 Free PMC article. - Schizophrenia and Orthoptic Conditions: A Literature Review.
McBride A, Arblaster G. McBride A, et al. Br Ir Orthopt J. 2024 Apr 26;20(1):133-145. doi: 10.22599/bioj.327. eCollection 2024. Br Ir Orthopt J. 2024. PMID: 38681187 Free PMC article. Review.
References
- Aine CJ, Supek S, George JS. Temporal dynamics of visual-evoked neuromagnetic sources: effects of stimulus parameters and selective attention. Int J Neurosci. 1995;80:79–104. - PubMed
- Allison T, Puce A, Spencer D, McCarthy G. Electrophysiological studies of human face perception I: potentials generated in occipitotemporal cortex by face and non-face stimuli. Cereb Cortex. 1999;9:415–30. - PubMed
- Andreasen NC. The scale for the assessment of negative symptoms (SANS) Iowa City, IA: The University of Iowa; 1984.
- Basinska A. Altered electrophysiological pattern of target detection in schizophrenia in the continuous attention test. Acta Neurobiol Exp. 1998;58:207–20. - PubMed
- Bentin S, Mouchetant-Rostaing Y, Giard MH, Echallier JF, Pernier J. ERP manifestations of processing printed words at different psycholinguistic levels: time course and scalp distribution. J Cognit Neurosci. 1999;11:235–60. - PubMed
Publication types
MeSH terms
Grants and funding
- R01 MH049334/MH/NIMH NIH HHS/United States
- R01 MH66374/MH/NIMH NIH HHS/United States
- R01 MH49334/MH/NIMH NIH HHS/United States
- K02 MH001439/MH/NIMH NIH HHS/United States
- R01 MH066374/MH/NIMH NIH HHS/United States
- K02 MH01439/MH/NIMH NIH HHS/United States
LinkOut - more resources
Full Text Sources
Medical


