Statistical tests for detecting positive selection by utilizing high-frequency variants - PubMed (original) (raw)
Statistical tests for detecting positive selection by utilizing high-frequency variants
Kai Zeng et al. Genetics. 2006 Nov.
Abstract
By comparing the low-, intermediate-, and high-frequency parts of the frequency spectrum, we gain information on the evolutionary forces that influence the pattern of polymorphism in population samples. We emphasize the high-frequency variants on which positive selection and negative (background) selection exhibit different effects. We propose a new estimator of theta (the product of effective population size and neutral mutation rate), thetaL, which is sensitive to the changes in high-frequency variants. The new thetaL allows us to revise Fay and Wu's H-test by normalization. To complement the existing statistics (the H-test and Tajima's D-test), we propose a new test, E, which relies on the difference between thetaL and Watterson's thetaW. We show that this test is most powerful in detecting the recovery phase after the loss of genetic diversity, which includes the postselective sweep phase. The sensitivities of these tests to (or robustness against) background selection and demographic changes are also considered. Overall, D and H in combination can be most effective in detecting positive selection while being insensitive to other perturbations. We thus propose a joint test, referred to as the DH test. Simulations indicate that DH is indeed sensitive primarily to directional selection and no other driving forces.
Figures
Figure 1.—
Variance of the five estimators of θ. Sample size (n) is 50.
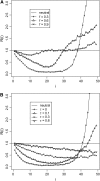
Figure 2.—
(A) Changes in at the linked neutral locus as the advantageous mutation increases in frequency (f). (B) Changes in R(i) at different times τ (measured in units of 4_N_ generations) after fixation of the advantageous mutation. In all simulations, the parameters are defined as follows: θ = 4_N_μ, where μ is the mutation rate for the linked neutral locus; s is the selective coefficient of the advantageous mutation and c is the recombination distance (between the neutral variation under investigation and the advantageous mutation nearby), which is usually scaled by the selective coefficient. The parameter values are θ = 5, s = 0.001, c/s = 0.02, and sample size (n) is 50. In the simulation for hitchhiking, we also incorporated intragenic recombination among the neutral variants under investigation. The intragenic recombination rate of the neutral locus, multiplied by 4_N_, is 25 here and in Figure 3. The values of θ and intragenic recombination rate were chosen to reflect the reality of D. melanogaster; i.e., the scaled local recombination rate is about fivefold as large as the local population mutation rate. Intragenic recombination in other cases has a negligible effect on the results and was not incorporated.
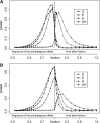
Figure 3.—
Power of the tests before and after hitchhiking is completed. The x_-axis on the left represents the increase in the frequency of the advantageous mutation; on the right is the time after fixation (measured in units of 4_N generations). All parameter values are the same as those of Figure 2. All tests were one-sided; values falling into the lower 5% tail of the null distribution were considered significant. Results shown in Figures 4–6 were produced by the same method. (A) c/s = ; (B) c/s = 0.02.
Figure 4.—
Sensitivity (or power) of the tests to population expansion. We assume that the effective population size increases 10-fold instantaneously at time 0 to θ = 5. Sample size (n) is 50. Time is measured in units of 4_N_ generations.
Figure 5.—
Sensitivity (or power) of the tests to population shrinkage. We assume that the effective population size decreases 10-fold instantaneously at time 0 to θ = 2. Sample size (n) is 50. Time is measured in units of 4_N_ generations.
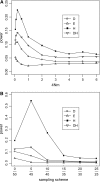
Figure 6.—
Sensitivity (or power) of the tests to population subdivision. A symmetric two-deme model with θ = 2 per deme (2_N_ genes per deme) was simulated. Populations are assumed to be in drift–migration equilibrium with symmetric migration at a rate of m, which is the fraction of new migrants each generation. Sample size (n) is 50. (A) Sensitivity as a function of the degree of population subdivision, expressed as 4_Nm_ on the x_-axis. All genes were sampled from one subpopulation. (B) Sensitivity as a function of the sampling skewness; for example, 5/45 means 5 genes are sampled from one subpopulation and 45 from the other. In this case, 4_Nm = 0.1, a value at which the tests show sensitivity to population subdivision in A.
Similar articles
- Compound tests for the detection of hitchhiking under positive selection.
Zeng K, Shi S, Wu CI. Zeng K, et al. Mol Biol Evol. 2007 Aug;24(8):1898-908. doi: 10.1093/molbev/msm119. Epub 2007 Jun 8. Mol Biol Evol. 2007. PMID: 17557886 - A new test for detecting recent positive selection that is free from the confounding impacts of demography.
Li H. Li H. Mol Biol Evol. 2011 Jan;28(1):365-75. doi: 10.1093/molbev/msq211. Epub 2010 Aug 13. Mol Biol Evol. 2011. PMID: 20709734 - Neutrality tests for sequences with missing data.
Ferretti L, Raineri E, Ramos-Onsins S. Ferretti L, et al. Genetics. 2012 Aug;191(4):1397-401. doi: 10.1534/genetics.112.139949. Epub 2012 Jun 1. Genetics. 2012. PMID: 22661328 Free PMC article. - Detecting directional selection in the presence of recent admixture in African-Americans.
Lohmueller KE, Bustamante CD, Clark AG. Lohmueller KE, et al. Genetics. 2011 Mar;187(3):823-35. doi: 10.1534/genetics.110.122739. Epub 2010 Dec 31. Genetics. 2011. PMID: 21196524 Free PMC article. - Comparisons of site- and haplotype-frequency methods for detecting positive selection.
Zeng K, Mano S, Shi S, Wu CI. Zeng K, et al. Mol Biol Evol. 2007 Jul;24(7):1562-74. doi: 10.1093/molbev/msm078. Epub 2007 Apr 21. Mol Biol Evol. 2007. PMID: 17449894
Cited by
- The Evolutionary Origin and Genetic Makeup of Domestic Horses.
Librado P, Fages A, Gaunitz C, Leonardi M, Wagner S, Khan N, Hanghøj K, Alquraishi SA, Alfarhan AH, Al-Rasheid KA, Der Sarkissian C, Schubert M, Orlando L. Librado P, et al. Genetics. 2016 Oct;204(2):423-434. doi: 10.1534/genetics.116.194860. Genetics. 2016. PMID: 27729493 Free PMC article. Review. - Genetic structure and demographic history of Colletotrichum gloeosporioides sensu lato and C. truncatum isolates from Trinidad and Mexico.
Rampersad SN, Perez-Brito D, Torres-Calzada C, Tapia-Tussell R, Carrington CV. Rampersad SN, et al. BMC Evol Biol. 2013 Jun 22;13:130. doi: 10.1186/1471-2148-13-130. BMC Evol Biol. 2013. PMID: 23800297 Free PMC article. - Adaptive genic evolution in the Drosophila genomes.
Shapiro JA, Huang W, Zhang C, Hubisz MJ, Lu J, Turissini DA, Fang S, Wang HY, Hudson RR, Nielsen R, Chen Z, Wu CI. Shapiro JA, et al. Proc Natl Acad Sci U S A. 2007 Feb 13;104(7):2271-6. doi: 10.1073/pnas.0610385104. Epub 2007 Feb 6. Proc Natl Acad Sci U S A. 2007. PMID: 17284599 Free PMC article. - Whole-genome sequencing of multiple Arabidopsis thaliana populations.
Cao J, Schneeberger K, Ossowski S, Günther T, Bender S, Fitz J, Koenig D, Lanz C, Stegle O, Lippert C, Wang X, Ott F, Müller J, Alonso-Blanco C, Borgwardt K, Schmid KJ, Weigel D. Cao J, et al. Nat Genet. 2011 Aug 28;43(10):956-63. doi: 10.1038/ng.911. Nat Genet. 2011. PMID: 21874002 - Recurrent events of positive selection in independent Drosophila lineages at the spermatogenesis gene roughex.
Llopart A, Comeron JM. Llopart A, et al. Genetics. 2008 Jun;179(2):1009-20. doi: 10.1534/genetics.107.086231. Epub 2008 May 27. Genetics. 2008. PMID: 18505872 Free PMC article.
References
- Bustamante, C. D., R. Nielsen, S. A. Sawyer, K. M. Olsen, M. D. Purugganan et al., 2002. The cost of inbreeding in Arabidopsis. Nature 416: 531–534. - PubMed
Publication types
MeSH terms
Grants and funding
- R01 GM050428/GM/NIGMS NIH HHS/United States
- R01 GM060777/GM/NIGMS NIH HHS/United States
- GM 60777/GM/NIGMS NIH HHS/United States
- GM50428/GM/NIGMS NIH HHS/United States
- R29 GM050428/GM/NIGMS NIH HHS/United States
LinkOut - more resources
Full Text Sources
Other Literature Sources


