SyMAP: A system for discovering and viewing syntenic regions of FPC maps - PubMed (original) (raw)
SyMAP: A system for discovering and viewing syntenic regions of FPC maps
Carol Soderlund et al. Genome Res. 2006 Sep.
Abstract
Previous approaches to comparing gene and chromosome organization between two genomes have been based on genetic maps or genomic sequences. We have developed a system to align an FPC-based physical map to a genomic sequence based on BAC end sequences and sequence-tagged hybridization markers and to align two FPC maps to one another based on shared markers and fingerprints. The system, called SyMAP (Synteny Mapping and Analysis Program), consists of an algorithm to compute synteny blocks and Web-based graphics to visualize the results. The approach to calculating the anchors (corresponding elements on the respective maps) maximizes the inclusion of anchors with different rates of divergence. Chains (putative syntenic sets of anchors) are computed using a dynamic programming algorithm, which includes off-diagonal anchors that result from map coordinate errors and small inversions. As the gap parameters (the distances allowed between anchors in a chain) can vary over different data sets and be difficult to set manually, they are automatically computed per data set. The criterion for a chain to be acceptable is based on the number of anchors and the Pearson correlation coefficient. Neighboring chains are merged into synteny blocks for display. This algorithm has been tested with three data sets that vary in the number of BACs, BAC end sequences, hybridization markers, distance between anchors, and number and antiquity of genome duplication events. The Web-based graphics uses Java for a highly interactive display that allows the user to interrogate the evidence of synteny.
Figures
Figure 1.
Two maize chromosomes aligning to rice chromosome 3. Blue marker names are found in both maize segments, while red names indicate markers that have been deleted or diverged beyond recognition in one segment. Note, most marker names are not shown because the list continues beyond the end of the blocks. The green lines are marker synteny and the purple lines are BES synteny.
Figure 2.
Incorrectly ordered BESs, false-positives, and inversions. (A)A set of overlapping clones is aligned to the genome based on BESs. The crossed lines may be a result of misplaced BESs, false-positives, or inversions. They may also be a result of incorrect clone endpoints (data not shown in this example). (B) Shows the effect on the matrix. The x's are the incorrectly ordered BESs and the o is a false positive.
Figure 3.
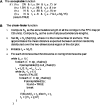
(A) The acceptable function determines whether a candidate chain qualifies. (B) The chain finder function adjusts the parameters to detect candidate chains. It calls the dp_chains, which is the dynamic programming function to find candidate chains, and it calls cull_chain, which removes anchors of the chain from the DAG and saves the chain for output.
Figure 4.
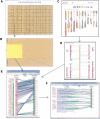
The SyMAP displays. (A) Java dot plot of two whole genomes, where the vertical axis is the FPC contigs and the horizontal axis is the sequenced genome. Each square represents the anchors shared by the two chromosomes. Clicking on a square zooms in on it. (B) From the square, a region can be selected which turns it yellow. Clicking a yellow region displays the close-up shown in E. (C) CGI/Perl display of the blocks aligned to the sequenced chromosomes. The blocks are color coded to indicate what FPC chromosome they are from. Clicking on a sequenced chromosome will show the close-up. (D) CGI/Perl display of the close-up of a sequenced chromosome, where the numbers in the small rectangles are contig numbers. Selecting a block will display the close-up. (E) Java close-up of the block. Purple lines are BESs. Green lines are markers. Select a contig to show the close-up. (F) Java close-up of the contig. The displays E and F have filters for the three tracks. The Block and Contig filters allow marker and clone names to be filtered on different properties. The Hit filter allows the lines between the anchor points to be filtered on different properties. The sequence filter allows the annotation, framework markers, and gaps to be made visible/invisible.
Figure 5.
A maize FPC (19.7.2005 release) to rice genomic sequence (IRGSP V4) dot plot. The dot plot by default is drawn to fit the browser; therefore, the maize coordinates are compressed. There is an option to show the dot plot to scale; the scaled dot plot for maize chromosome 6 and rice chromosome 6 is shown in the lower right corner (covering the dot plots for maize 5–10 and rice 11–12).
Similar articles
- A comparative map viewer integrating genetic maps for Brassica and Arabidopsis.
Lim GA, Jewell EG, Li X, Erwin TA, Love C, Batley J, Spangenberg G, Edwards D. Lim GA, et al. BMC Plant Biol. 2007 Jul 24;7:40. doi: 10.1186/1471-2229-7-40. BMC Plant Biol. 2007. PMID: 17645810 Free PMC article. - SynBrowse: a synteny browser for comparative sequence analysis.
Pan X, Stein L, Brendel V. Pan X, et al. Bioinformatics. 2005 Sep 1;21(17):3461-8. doi: 10.1093/bioinformatics/bti555. Epub 2005 Jun 30. Bioinformatics. 2005. PMID: 15994196 - Accurate identification of orthologous segments among multiple genomes.
Hachiya T, Osana Y, Popendorf K, Sakakibara Y. Hachiya T, et al. Bioinformatics. 2009 Apr 1;25(7):853-60. doi: 10.1093/bioinformatics/btp070. Epub 2009 Feb 2. Bioinformatics. 2009. PMID: 19188192 - Techniques for multi-genome synteny analysis to overcome assembly limitations.
Bhutkar A, Russo S, Smith TF, Gelbart WM. Bhutkar A, et al. Genome Inform. 2006;17(2):152-61. Genome Inform. 2006. PMID: 17503388 - How to usefully compare homologous plant genes and chromosomes as DNA sequences.
Lyons E, Freeling M. Lyons E, et al. Plant J. 2008 Feb;53(4):661-73. doi: 10.1111/j.1365-313X.2007.03326.x. Plant J. 2008. PMID: 18269575 Review.
Cited by
- Whole Genome Mapping with Feature Sets from High-Throughput Sequencing Data.
Pan Y, Wang X, Liu L, Wang H, Luo M. Pan Y, et al. PLoS One. 2016 Sep 9;11(9):e0161583. doi: 10.1371/journal.pone.0161583. eCollection 2016. PLoS One. 2016. PMID: 27611682 Free PMC article. - Global genomic diversity of Oryza sativa varieties revealed by comparative physical mapping.
Wang X, Kudrna DA, Pan Y, Wang H, Liu L, Lin H, Zhang J, Song X, Goicoechea JL, Wing RA, Zhang Q, Luo M. Wang X, et al. Genetics. 2014 Apr;196(4):937-49. doi: 10.1534/genetics.113.159970. Epub 2014 Jan 14. Genetics. 2014. PMID: 24424778 Free PMC article. - Comparative genome analysis indicates high evolutionary potential of pathogenicity genes in Colletotrichum tanaceti.
Lelwala RV, Korhonen PK, Young ND, Scott JB, Ades PK, Gasser RB, Taylor PWJ. Lelwala RV, et al. PLoS One. 2019 May 31;14(5):e0212248. doi: 10.1371/journal.pone.0212248. eCollection 2019. PLoS One. 2019. PMID: 31150449 Free PMC article. - A genetically anchored physical framework for Theobroma cacao cv. Matina 1-6.
Saski CA, Feltus FA, Staton ME, Blackmon BP, Ficklin SP, Kuhn DN, Schnell RJ, Shapiro H, Motamayor JC. Saski CA, et al. BMC Genomics. 2011 Aug 16;12:413. doi: 10.1186/1471-2164-12-413. BMC Genomics. 2011. PMID: 21846342 Free PMC article. - Draft genome sequence of bitter gourd (Momordica charantia), a vegetable and medicinal plant in tropical and subtropical regions.
Urasaki N, Takagi H, Natsume S, Uemura A, Taniai N, Miyagi N, Fukushima M, Suzuki S, Tarora K, Tamaki M, Sakamoto M, Terauchi R, Matsumura H. Urasaki N, et al. DNA Res. 2017 Feb 1;24(1):51-58. doi: 10.1093/dnares/dsw047. DNA Res. 2017. PMID: 28028039 Free PMC article.
References
- Altschul S.F., Madden T.L., Schaffer A.A., Zhang J., Zhang Z., Miller W., Lipman D.J., Madden T.L., Schaffer A.A., Zhang J., Zhang Z., Miller W., Lipman D.J., Schaffer A.A., Zhang J., Zhang Z., Miller W., Lipman D.J., Zhang J., Zhang Z., Miller W., Lipman D.J., Zhang Z., Miller W., Lipman D.J., Miller W., Lipman D.J., Lipman D.J. Gapped BLAST and PSI-BLAST: A new generation of protein database search programs. Nucleic Acids Res. 1997;25:3389–3402. - PMC - PubMed
- Bowers J.E., Abbey C., Anderson S., Chang C., Draye X., Hoppe A.H., Jessup R., Lemke C., Lennington J., Li Z., Abbey C., Anderson S., Chang C., Draye X., Hoppe A.H., Jessup R., Lemke C., Lennington J., Li Z., Anderson S., Chang C., Draye X., Hoppe A.H., Jessup R., Lemke C., Lennington J., Li Z., Chang C., Draye X., Hoppe A.H., Jessup R., Lemke C., Lennington J., Li Z., Draye X., Hoppe A.H., Jessup R., Lemke C., Lennington J., Li Z., Hoppe A.H., Jessup R., Lemke C., Lennington J., Li Z., Jessup R., Lemke C., Lennington J., Li Z., Lemke C., Lennington J., Li Z., Lennington J., Li Z., Li Z., et al. A high-density genetic recombination map of sequence-tagged sites for sorghum, as a framework for comparative structural and evolutionary genomics of tropical grains and grasses. Genetics. 2003;165:367–386. - PMC - PubMed
- Bowers J.E., Arias M.A., Asher R., Avise J.A., Ball R.T., Brewer G.A., Buss R.W., Chen A.H., Edwards T.M., Estill J.C., Arias M.A., Asher R., Avise J.A., Ball R.T., Brewer G.A., Buss R.W., Chen A.H., Edwards T.M., Estill J.C., Asher R., Avise J.A., Ball R.T., Brewer G.A., Buss R.W., Chen A.H., Edwards T.M., Estill J.C., Avise J.A., Ball R.T., Brewer G.A., Buss R.W., Chen A.H., Edwards T.M., Estill J.C., Ball R.T., Brewer G.A., Buss R.W., Chen A.H., Edwards T.M., Estill J.C., Brewer G.A., Buss R.W., Chen A.H., Edwards T.M., Estill J.C., Buss R.W., Chen A.H., Edwards T.M., Estill J.C., Chen A.H., Edwards T.M., Estill J.C., Edwards T.M., Estill J.C., Estill J.C., et al. Comparative physical mapping links conservation of microsynteny to chromosome structure and recombination in grasses. Proc. Natl. Acad. Sci. 2005;102:13206–13211. - PMC - PubMed
- Calabrese P.P., Chakravarty S., Vision T.J., Chakravarty S., Vision T.J., Vision T.J. Fast identification and statistical evaluation of segmental homologies in comparative maps. Bioinformatics. 2003;19::i74–i80. - PubMed
Publication types
MeSH terms
LinkOut - more resources
Full Text Sources
Other Literature Sources
Research Materials
Miscellaneous


