Chromosome Conformation Capture Carbon Copy (5C): a massively parallel solution for mapping interactions between genomic elements - PubMed (original) (raw)
. 2006 Oct;16(10):1299-309.
doi: 10.1101/gr.5571506. Epub 2006 Sep 5.
Todd A Richmond, Ramy A Arnaout, Rebecca R Selzer, William L Lee, Tracey A Honan, Eric D Rubio, Anton Krumm, Justin Lamb, Chad Nusbaum, Roland D Green, Job Dekker
Affiliations
- PMID: 16954542
- PMCID: PMC1581439
- DOI: 10.1101/gr.5571506
Chromosome Conformation Capture Carbon Copy (5C): a massively parallel solution for mapping interactions between genomic elements
Josée Dostie et al. Genome Res. 2006 Oct.
Abstract
Physical interactions between genetic elements located throughout the genome play important roles in gene regulation and can be identified with the Chromosome Conformation Capture (3C) methodology. 3C converts physical chromatin interactions into specific ligation products, which are quantified individually by PCR. Here we present a high-throughput 3C approach, 3C-Carbon Copy (5C), that employs microarrays or quantitative DNA sequencing using 454-technology as detection methods. We applied 5C to analyze a 400-kb region containing the human beta-globin locus and a 100-kb conserved gene desert region. We validated 5C by detection of several previously identified looping interactions in the beta-globin locus. We also identified a new looping interaction in K562 cells between the beta-globin Locus Control Region and the gamma-beta-globin intergenic region. Interestingly, this region has been implicated in the control of developmental globin gene switching. 5C should be widely applicable for large-scale mapping of cis- and trans- interaction networks of genomic elements and for the study of higher-order chromosome structure.
Figures
Figure 1.
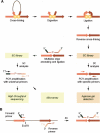
Schematic representation of 5C. (A) A 3C library is generated by conventional 3C and then converted into a 5C library by annealing and ligating 5C oligonucleotides in a multiplex setting. 5C libraries are then analyzed on a microarray or by quantitative sequencing. (B) 5C primer design. Forward 5C primers anneal to the sense strand of the 3′-end of restriction fragments and include half of the selected restriction site. All forward primers feature a common 5′-end tail containing the T7 promoter sequence. Reverse 5C primers anneal to the antisense strand of the 3′-end of restriction fragments, including half of the restriction site. All reverse primers contain a common 3′-end tail featuring the complementary T3 sequence (T3c) and are phosphorylated at the 5′-end. 5C forward and reverse primers anneal to the same strand of head-to-head ligation products present in the 3C library.
Figure 2.
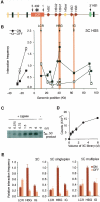
Analysis of the human β-globin locus and development of 5C. (A) Schematic representation of the human β-globin locus. The β-globin genes and pseudogene are illustrated by red and yellow arrows, respectively. The positions of HSs are indicated with black arrows. Olfactory genes and pseudogenes are represented by black and yellow rectangles, respectively. The location of a gene of unknown function (EST BU661736) is indicated by a green oval. (B) 3C analysis of interactions between the LCR (HS5) and the rest of the β-globin locus. Interaction frequencies were measured by semiquantitative PCR in K562 (locus ON) and GM06990 (locus OFF) cells. The _y_-axis indicates normalized interaction frequencies; the _x_-axis shows the genomic position relative to the LCR. Each data point is the average of at least three PCR reactions; bars represent the standard error of the mean (S.E.M.). (C) Representative 3C library titration in singleplex LMA with 5C primers. Increasing volumes of 3C library from K562 cells were analyzed with gene desert 5C primers, and the amplified 5C ligation products were analyzed on an agarose gel. An asterisk indicates a nonspecific band. (D) Quantification of titration shown in C. Each data point corresponds to the average of three PCR reactions; bars represent the S.E.M. (E) 3C, singleplex, and sixplex LMA detection of looping interactions between HS5 and the Aγ-globin gene HBG1. Interaction frequencies from both cell lines were expressed relative to the K562 LCR–Aγ-globin interaction (HBG1), which was set at 1. Each histogram value represents the average of at least three PCRs; bars represent the S.E.M.
Figure 3.
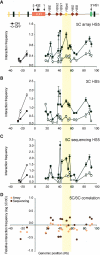
Microarray and DNA sequencing analysis of 5C libraries recapitulates 3C interaction profiles. (A) 5C analysis of human β-globin locus HS5 chromatin interactions in K562 (ON) and GM06990 (OFF) cells detected by microarray. The _y_-axis indicates normalized interaction frequencies. The _x_-axis indicates the genomic position relative to the LCR. Each data point is the average of six hybridization signals obtained with probes of 38–48 bases, and error bars represent the S.E.M. A schematic representation of the entire locus is presented at the top. (B) Conventional 3C analysis of human β-globin HS5 chromatin interactions. (C) 5C analysis of human β-globin HS5 interactions as detected by quantitative DNA sequencing. Error bars indicate the standard deviation. We assumed that count data were drawn for a Poisson distribution and, thus, that the standard deviation equals the square root of the count number. Standard deviations were propagated using the delta method. (D) Correlation between 3C and 5C human β-globin locus profiles from K562 cells. Microarray and DNA sequencing 5C results were compared to corresponding 3C data by calculating the fold difference (log ratio 5C/3C) for each pair of interacting fragments (_y_-axis). The _x_-axis indicates the genomic position relative to the LCR. The colored vertical bar across all panels highlights the interaction between the LCR and the region between the γ- and δ-globin genes that contains the β-globin pseudogene.
Figure 4.
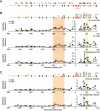
Large-scale 5C analysis of the human β-globin locus. (A) Positions of forward (top) and reverse (bottom) 5C primers within the β-globin locus. (B) Chromatin interaction profile of HS5 with a 400-kb region surrounding the LCR. Physical interactions in K562 (ON) and GM06990 (OFF) cells were measured by 5C and microarrays (top), 3C (middle), and 5C and quantitative sequencing (bottom) analysis. The β-globin locus illustrated above the profiles includes features described in Figure 2A. The forward-facing arrow indicates the location of an alternative ε-globin transcription start site. Light and dark orange ovals represent the Ubiquilin 3 (UBQLN3) and MGC20470 hypothetical genes, respectively. Arrows indicate HSs identified in K562 cells. Red arrows indicate HSs identified in K562 cells that have been proposed to be orthologous to HS-62.5/-62.0 in the murine locus (Farrell et al. 2002; Bulger et al. 2003). (C) Chromatin interaction profile of HS2/3/4 of the LCR with the 400-kb region around the LCR as determined by microarray (top) and quantitative sequencing (bottom). Colored vertical bars highlight the interactions between the LCR and upstream HSs and the γ–δ intergenic region.
Figure 5.
Analysis of the conformation of the gene desert control region. (A) Positions of alternating 5C forward (top) and reverse (bottom) primers throughout the gene desert control region. (B) Chromatin interaction frequencies of the gene desert region as determined by conventional 3C (left panel), by 5C and microarrays (middle panel), and by 5C and quantitative sequencing (right panel). Interaction frequencies are plotted vs. genomic distance between the interacting fragments. Bars represent the S.E.M. Interaction frequencies detected in K562 cells are also presented as two-dimensional heat maps in which the color of each square is a measure of the interaction frequency. Note: Primers 3, 6, and 20 recognize repetitive sequences. These primers were included to generate 5C libraries, but data obtained with these primers are not included in B. Interaction frequencies obtained with these primers are presented in Supplemental Table 7.
Similar articles
- Mapping networks of physical interactions between genomic elements using 5C technology.
Dostie J, Dekker J. Dostie J, et al. Nat Protoc. 2007;2(4):988-1002. doi: 10.1038/nprot.2007.116. Nat Protoc. 2007. PMID: 17446898 - Chromosome conformation capture carbon copy technology.
Dostie J, Zhan Y, Dekker J. Dostie J, et al. Curr Protoc Mol Biol. 2007 Oct;Chapter 21:Unit 21.14. doi: 10.1002/0471142727.mb2114s80. Curr Protoc Mol Biol. 2007. PMID: 18265398 - Determining spatial chromatin organization of large genomic regions using 5C technology.
van Berkum NL, Dekker J. van Berkum NL, et al. Methods Mol Biol. 2009;567:189-213. doi: 10.1007/978-1-60327-414-2_13. Methods Mol Biol. 2009. PMID: 19588094 Free PMC article. Review. - 5C-ID: Increased resolution Chromosome-Conformation-Capture-Carbon-Copy with in situ 3C and double alternating primer design.
Kim JH, Titus KR, Gong W, Beagan JA, Cao Z, Phillips-Cremins JE. Kim JH, et al. Methods. 2018 Jun 1;142:39-46. doi: 10.1016/j.ymeth.2018.05.005. Epub 2018 May 24. Methods. 2018. PMID: 29772275 Free PMC article. - Chromatin structure and control of beta-like globin gene switching.
Harju S, McQueen KJ, Peterson KR. Harju S, et al. Exp Biol Med (Maywood). 2002 Oct;227(9):683-700. doi: 10.1177/153537020222700902. Exp Biol Med (Maywood). 2002. PMID: 12324650 Review.
Cited by
- The chromosome folding problem and how cells solve it.
Dekker J, Mirny LA. Dekker J, et al. Cell. 2024 Nov 14;187(23):6424-6450. doi: 10.1016/j.cell.2024.10.026. Cell. 2024. PMID: 39547207 Free PMC article. Review. - The 3D Genome in Brain Development: An Exploration of Molecular Mechanisms and Experimental Methods.
Rahman S, Roussos P. Rahman S, et al. Neurosci Insights. 2024 Oct 29;19:26331055241293455. doi: 10.1177/26331055241293455. eCollection 2024. Neurosci Insights. 2024. PMID: 39494115 Free PMC article. Review. - Tracing the Chromatin: From 3C to Live-Cell Imaging.
Lacen AN, Lee HT. Lacen AN, et al. Chem Biomed Imaging. 2024 Jun 25;2(10):659-682. doi: 10.1021/cbmi.4c00033. eCollection 2024 Oct 28. Chem Biomed Imaging. 2024. PMID: 39483638 Free PMC article. Review. - Translation of genome-wide association study: from genomic signals to biological insights.
Bruner WS, Grant SFA. Bruner WS, et al. Front Genet. 2024 Oct 3;15:1375481. doi: 10.3389/fgene.2024.1375481. eCollection 2024. Front Genet. 2024. PMID: 39421299 Free PMC article. Review. - A guide to studying 3D genome structure and dynamics in the kidney.
Beliveau BJ, Akilesh S. Beliveau BJ, et al. Nat Rev Nephrol. 2024 Oct 15. doi: 10.1038/s41581-024-00894-2. Online ahead of print. Nat Rev Nephrol. 2024. PMID: 39406927 Review.
References
- Bender M.A., Byron R., Ragoczy T., Telling A., Bulger M., Groudine M., Byron R., Ragoczy T., Telling A., Bulger M., Groudine M., Ragoczy T., Telling A., Bulger M., Groudine M., Telling A., Bulger M., Groudine M., Bulger M., Groudine M., Groudine M. Flanking HS-62.5 and 3′HS1, and regions upstream of the LCR, are not required for β-globin transcription. Blood. 2006;108:1395–1401. - PMC - PubMed
- Bibikova M., Lin Z., Zhou L., Chudin E., Garcia E.W., Wu B., Doucet D., Thomas N.J., Wang Y., Vollmer E., Lin Z., Zhou L., Chudin E., Garcia E.W., Wu B., Doucet D., Thomas N.J., Wang Y., Vollmer E., Zhou L., Chudin E., Garcia E.W., Wu B., Doucet D., Thomas N.J., Wang Y., Vollmer E., Chudin E., Garcia E.W., Wu B., Doucet D., Thomas N.J., Wang Y., Vollmer E., Garcia E.W., Wu B., Doucet D., Thomas N.J., Wang Y., Vollmer E., Wu B., Doucet D., Thomas N.J., Wang Y., Vollmer E., Doucet D., Thomas N.J., Wang Y., Vollmer E., Thomas N.J., Wang Y., Vollmer E., Wang Y., Vollmer E., Vollmer E., et al. High-throughput DNA methylation profiling using universal bead arrays. Genome Res. 2005;16:383–393. - PMC - PubMed
- Bulger M., Bender M.A., van Doorninck J.H., Wertman B., Farrell C.M., Felsenfeld G., Groudine M., Hardison R., Bender M.A., van Doorninck J.H., Wertman B., Farrell C.M., Felsenfeld G., Groudine M., Hardison R., van Doorninck J.H., Wertman B., Farrell C.M., Felsenfeld G., Groudine M., Hardison R., Wertman B., Farrell C.M., Felsenfeld G., Groudine M., Hardison R., Farrell C.M., Felsenfeld G., Groudine M., Hardison R., Felsenfeld G., Groudine M., Hardison R., Groudine M., Hardison R., Hardison R. Comparative structural and functional analysis of the olfactory receptor genes flanking the human and mouse β-globin gene clusters. Proc. Natl. Acad. Sci. 2000;97:14560–14565. - PMC - PubMed
- Bulger M., Schubeler D., Bender M.A., Hamilton J., Farrell C.M., Hardison R.C., Groudine M., Schubeler D., Bender M.A., Hamilton J., Farrell C.M., Hardison R.C., Groudine M., Bender M.A., Hamilton J., Farrell C.M., Hardison R.C., Groudine M., Hamilton J., Farrell C.M., Hardison R.C., Groudine M., Farrell C.M., Hardison R.C., Groudine M., Hardison R.C., Groudine M., Groudine M. A complex chromatin landscape revealed by patterns of nuclease sensitiv ity and histone modification within the mouse β-globin locus. Mol. Cell. Biol. 2003;23:5234–5244. - PMC - PubMed
- Calzolari R., McMorrow T., Yannoutsos N., Langeveld A., Grosveld F., McMorrow T., Yannoutsos N., Langeveld A., Grosveld F., Yannoutsos N., Langeveld A., Grosveld F., Langeveld A., Grosveld F., Grosveld F. Deletion of a region that is a candidate for the difference between the deletion forms of hereditary persistence of fetal hemoglobin and δβ-thalassemia affects β- but not γ-globin gene expression. EMBO J. 1999;18:949–958. - PMC - PubMed
Publication types
MeSH terms
Substances
Grants and funding
- HG003143/HG/NHGRI NIH HHS/United States
- CA109597/CA/NCI NIH HHS/United States
- R01 GM078986/GM/NIGMS NIH HHS/United States
- R01GM078986/GM/NIGMS NIH HHS/United States
- R01 CA109597/CA/NCI NIH HHS/United States
- R01 HG003143/HG/NHGRI NIH HHS/United States
- R01 GM078986-01/GM/NIGMS NIH HHS/United States
- R01 HG003129/HG/NHGRI NIH HHS/United States
- HG003129/HG/NHGRI NIH HHS/United States
LinkOut - more resources
Full Text Sources
Other Literature Sources


