Identifying gene regulatory elements by genomic microarray mapping of DNaseI hypersensitive sites - PubMed (original) (raw)
Comparative Study
. 2006 Oct;16(10):1310-9.
doi: 10.1101/gr.5373606. Epub 2006 Sep 8.
Pawan Dhami, Berthold Göttgens, Alexander W Bruce, Peter J Campbell, Shane C Dillon, Aileen M Smith, Christoph Koch, Ian J Donaldson, Mike A Scott, Ian Dunham, Mary E Janes, David Vetrie, Anthony R Green
Affiliations
- PMID: 16963707
- PMCID: PMC1581440
- DOI: 10.1101/gr.5373606
Comparative Study
Identifying gene regulatory elements by genomic microarray mapping of DNaseI hypersensitive sites
George A Follows et al. Genome Res. 2006 Oct.
Abstract
The identification of cis-regulatory elements is central to understanding gene transcription. Hypersensitivity of cis-regulatory elements to digestion with DNaseI remains the gold-standard approach to locating such elements. Traditional methods used to identify DNaseI hypersensitive sites are cumbersome and can only be applied to short stretches of DNA at defined locations. Here we report the development of a novel genomic array-based approach to DNaseI hypersensitive site mapping (ADHM) that permits precise, large-scale identification of such sites from as few as 5 million cells. Using ADHM we identified all previously recognized hematopoietic regulatory elements across 200 kb of the mouse T-cell acute lymphocytic leukemia-1 (Tal1) locus, and, in addition, identified two novel elements within the locus, which show transcriptional regulatory activity. We further validated the ADHM protocol by mapping the DNaseI hypersensitive sites across 250 kb of the human TAL1 locus in CD34+ primary stem/progenitor cells and K562 cells and by mapping the previously known DNaseI hypersensitive sites across 240 kb of the human alpha-globin locus in K562 cells. ADHM provides a powerful approach to identifying DNaseI hypersensitive sites across large genomic regions.
Figures
Figure 1.
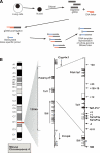
Protocol outline and map of the mouse Tal1 locus. (A) Diagrammatic representation of the protocol followed to obtain DNA template representative of whole-genome DNaseI hypersensitive sites. Nuclei are isolated and treated with DNaseI. DNA is then extracted and repaired to blunt ends with T4 DNA polymerase; (gDNA) digested, repaired genomic DNA. Following ligation to an asymmetric double-stranded linker, biotinylated primer extension is used followed by extraction of biotinylated primer-extended DNA using streptavidin beads. This template is then labeled and hybridized to genomic arrays as described in Methods. (B) Diagrammatic map of mouse chromosome 4 showing the organization of the three genes: Stil (Scl/Tal1 Interrupting Locus), Tal1, and Pdzk1ip1. In the middle panel, the direction of transcription is indicated with black arrows, while the locations of known Stil and Tal1 regulatory elements are indicated with arrows in the far right panel.
Figure 2.
DNaseI hypersensitive site profiles across the mouse Tal1 locus. (A) Organization of the mouse Stil, Tal1, and Pdzk1ip1 genes, with wide and narrow bars representing translated and untranslated exons, respectively. The black bars represent the mouse/rat/human/dog/chicken overall conservation score quantified using phastCons (Siepel et al. 2005), derived using the MultiZ species alignment program (
) (Hinrichs et al. 2006). (B) DNaseI sensitivity plot from 416B cells across the Tal1 locus. Fold enrichment over non-enriched input is plotted (log2) against genomic position in kilobases. The plots in B are the means of four independent array experiments, each hybridized in triplicate, as detailed in Methods. The width of each bar represents the width of each spotted PCR product on the array, with overlapping bars representing overlapping PCR products. Red bars represent known regulatory elements, while blue bars represent novel elements identified in this study. Significant enrichments (P ≤ 0.05) are indicated with an asterisk or asterisk + bar (at least two adjacent tiles). (0k) Mouse chromosome 4 coordinate 113,334,279 (NCBI build 33). Functional elements are described in Table 1 and the text, and refer to the location in kilobases relative to the start of mouse Tal1 exon 1a.
Figure 3.
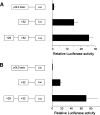
Transfection experiments confirm the functional activity of the novel mouse Tal1 elements identified from the DNaseI hypersensitive site profiles. (A) A representative transient transfection experiment in 416B cells with bars representing means of triplicate relative luminescence values of construct activity +SD as detailed in Methods. (B) A representative stable transfection experiment in MDCT cells with bars representing means of quadruplicate relative luminescence values of construct activity +SD.
Figure 4.
DNaseI hypersensitive site profiles across the human TAL1 locus. (A) Organization of the human STIL, TAL1, and PDZK1IP1 genes, with wide and narrow bars representing translated and untranslated exons, respectively. The black bars represent the human/chimp/mouse/rat/dog/chicken/ Fugu/zebrafish overall conservation score quantified using phastCons (Siepel et al. 2005), derived using the MultiZ species alignment program (
) (Hinrichs et al. 2006). (B) DNaseI sensitivity plot from normal donor and CML CD34+ cells and K562 cell lines across the TAL1 locus. Fold enrichment over non-enriched input is plotted (log2) against genomic position in kilobases. The normal donor and K562 plots represent the mean values of four independent array experiments, while the CML data represent the mean of two separate experiments, each hybridized in triplicate as detailed in Methods. The width of each bar represents the width of each spotted PCR product on the array, with overlapping bars representing overlapping PCR products. Red bars represent known regulatory elements or regions homologous to known mouse regulatory elements. The blue bars locate the human region homologous to the novel mouse regulatory elements identified in this study. Significant enrichments (P ≤ 0.05) are indicated with an asterisk or asterisk + bar (at least two adjacent tiles). (0k) Human chromosome 1 coordinate 47,505,065 (NCBI build 35). Functional elements are described in Table 1 and the text, and refer to the location in kilobases of the conserved elements relative to the start of human exon 1a.
Figure 5.
DNaseI hypersensitive site profile across the human α-globin locus. (A) Organization of the 12 genes across 240 kb, with wide and narrow bars representing translated and untranslated exons, respectively. The black bars represent the human/chimp/mouse/rat/dog/chicken overall conservation score quantified using phastCons (Siepel et al. 2005), derived using the MultiZ species alignment program (
) (Hinrichs et al. 2006). (B) DNaseI sensitivity plot from K562 cell lines. Fold enrichment over non-enriched input is plotted (log2) against genomic position in kilobases. The plot represents the mean values of seven separate array experiments, each hybridized in duplicate as detailed in Methods. The width of each bar represents the width of each spotted PCR product on the array, with overlapping bars representing overlapping PCR products. Red bars represent known regulatory elements, while dashed red bars are known elements not represented on the array. (0k) Human chromosome 16 coordinate 17,913 (NCBI build 35). Significant enrichments (P ≤ 0.05) are indicated with an asterisk or asterisk + bar (at least two adjacent tiles), while crosses represent the three known hypersensitive sites that were enriched above baseline, but did not meet statistical criteria for significant enrichment. The “V” indicates the two novel significant sites identified within the region of the locus previously mapped by conventional techniques (Yagi et al. 1986; Higgs et al. 1990; Vyas et al. 1992; Hughes et al. 2005; D. Higgs, pers. comm.). Functional elements refer to kilobases relative to HBZ exon 1.
Similar articles
- Identification and characterization of cell type-specific and ubiquitous chromatin regulatory structures in the human genome.
Xi H, Shulha HP, Lin JM, Vales TR, Fu Y, Bodine DM, McKay RD, Chenoweth JG, Tesar PJ, Furey TS, Ren B, Weng Z, Crawford GE. Xi H, et al. PLoS Genet. 2007 Aug;3(8):e136. doi: 10.1371/journal.pgen.0030136. Epub 2007 Jul 2. PLoS Genet. 2007. PMID: 17708682 Free PMC article. - Real-time PCR mapping of DNaseI-hypersensitive sites using a novel ligation-mediated amplification technique.
Follows GA, Janes ME, Vallier L, Green AR, Gottgens B. Follows GA, et al. Nucleic Acids Res. 2007;35(8):e56. doi: 10.1093/nar/gkm108. Epub 2007 Mar 27. Nucleic Acids Res. 2007. PMID: 17389645 Free PMC article. - Mapping regulatory elements by DNaseI hypersensitivity chip (DNase-Chip).
Shibata Y, Crawford GE. Shibata Y, et al. Methods Mol Biol. 2009;556:177-90. doi: 10.1007/978-1-60327-192-9_13. Methods Mol Biol. 2009. PMID: 19488879 - Advances of DNase-seq for mapping active gene regulatory elements across the genome in animals.
Chen A, Chen D, Chen Y. Chen A, et al. Gene. 2018 Aug 15;667:83-94. doi: 10.1016/j.gene.2018.05.033. Epub 2018 May 14. Gene. 2018. PMID: 29772251 Review. - Distant sequences which regulate globin genes.
Paul J, Allan M, Gilmour S, Spandidos D, Montague P, Grindlay J, Vass K, Zhu JD, Gow J. Paul J, et al. Prog Clin Biol Res. 1985;191:29-48. Prog Clin Biol Res. 1985. PMID: 2996023 Review.
Cited by
- Chromatin profiling across the human tumour necrosis factor gene locus reveals a complex, cell type-specific landscape with novel regulatory elements.
Taylor JM, Wicks K, Vandiedonck C, Knight JC. Taylor JM, et al. Nucleic Acids Res. 2008 Sep;36(15):4845-62. doi: 10.1093/nar/gkn444. Epub 2008 Jul 24. Nucleic Acids Res. 2008. PMID: 18653526 Free PMC article. - Endoglin expression in blood and endothelium is differentially regulated by modular assembly of the Ets/Gata hemangioblast code.
Pimanda JE, Chan WY, Wilson NK, Smith AM, Kinston S, Knezevic K, Janes ME, Landry JR, Kolb-Kokocinski A, Frampton J, Tannahill D, Ottersbach K, Follows GA, Lacaud G, Kouskoff V, Göttgens B. Pimanda JE, et al. Blood. 2008 Dec 1;112(12):4512-22. doi: 10.1182/blood-2008-05-157560. Epub 2008 Sep 19. Blood. 2008. PMID: 18805961 Free PMC article. - Transcriptional regulation of Elf-1: locus-wide analysis reveals four distinct promoters, a tissue-specific enhancer, control by PU.1 and the importance of Elf-1 downregulation for erythroid maturation.
Calero-Nieto FJ, Wood AD, Wilson NK, Kinston S, Landry JR, Göttgens B. Calero-Nieto FJ, et al. Nucleic Acids Res. 2010 Oct;38(19):6363-74. doi: 10.1093/nar/gkq490. Epub 2010 Jun 4. Nucleic Acids Res. 2010. PMID: 20525788 Free PMC article. - Sequence composition similarities with the 7SL RNA are highly predictive of functional genomic features.
Paquet Y, Anderson A. Paquet Y, et al. Nucleic Acids Res. 2010 Aug;38(15):4907-16. doi: 10.1093/nar/gkq234. Epub 2010 Apr 14. Nucleic Acids Res. 2010. PMID: 20392819 Free PMC article. - Genomic approaches uncover increasing complexities in the regulatory landscape at the human SCL (TAL1) locus.
Dhami P, Bruce AW, Jim JH, Dillon SC, Hall A, Cooper JL, Bonhoure N, Chiang K, Ellis PD, Langford C, Andrews RM, Vetrie D. Dhami P, et al. PLoS One. 2010 Feb 5;5(2):e9059. doi: 10.1371/journal.pone.0009059. PLoS One. 2010. PMID: 20140202 Free PMC article.
References
- Aplan P.D., Lombardi D.P., Ginsberg A.M., Cossman J., Bertness V.L., Kirsch I.R., Lombardi D.P., Ginsberg A.M., Cossman J., Bertness V.L., Kirsch I.R., Ginsberg A.M., Cossman J., Bertness V.L., Kirsch I.R., Cossman J., Bertness V.L., Kirsch I.R., Bertness V.L., Kirsch I.R., Kirsch I.R. Disruption of the human SCL locus by “illegitimate” V-(D)-J recombinase activity. Science. 1990;250:1426–1429. - PubMed
- Bockamp E.O., McLaughlin F., Murrell A.M., Göttgens B., Robb L., Begley C.G., Green A.R., McLaughlin F., Murrell A.M., Göttgens B., Robb L., Begley C.G., Green A.R., Murrell A.M., Göttgens B., Robb L., Begley C.G., Green A.R., Göttgens B., Robb L., Begley C.G., Green A.R., Robb L., Begley C.G., Green A.R., Begley C.G., Green A.R., Green A.R. Lineage-restricted regulation of the murine SCL/TAL-1 promoter. Blood. 1995;86:1502–1514. - PubMed
- Bockamp E.O., McLaughlin F., Göttgens B., Murrell A.M., Elefanty A.G., Green A.R., McLaughlin F., Göttgens B., Murrell A.M., Elefanty A.G., Green A.R., Göttgens B., Murrell A.M., Elefanty A.G., Green A.R., Murrell A.M., Elefanty A.G., Green A.R., Elefanty A.G., Green A.R., Green A.R. Distinct mechanisms direct SCL/tal-1 expression in erythroid cells and CD34 positive primitive myeloid cells. J. Biol. Chem. 1997;272:8781–8790. - PubMed
- Bockamp E.O., Fordham J.L., Göttgens B., Murrell A.M., Sanchez M.J., Green A.R., Fordham J.L., Göttgens B., Murrell A.M., Sanchez M.J., Green A.R., Göttgens B., Murrell A.M., Sanchez M.J., Green A.R., Murrell A.M., Sanchez M.J., Green A.R., Sanchez M.J., Green A.R., Green A.R. Transcriptional regulation of the stem cell leukemia gene by PU.1 and Elf-1. J. Biol. Chem. 1998;273:29032–29042. - PubMed
Publication types
MeSH terms
Substances
LinkOut - more resources
Full Text Sources
Other Literature Sources


