Placental but not heart defects are associated with elevated hypoxia-inducible factor alpha levels in mice lacking prolyl hydroxylase domain protein 2 - PubMed (original) (raw)
Placental but not heart defects are associated with elevated hypoxia-inducible factor alpha levels in mice lacking prolyl hydroxylase domain protein 2
Kotaro Takeda et al. Mol Cell Biol. 2006 Nov.
Abstract
PHD1, PHD2, and PHD3 are prolyl hydroxylase domain proteins that regulate the stability of hypoxia-inducible factor alpha subunits (HIF-alpha). To determine the roles of individual PHDs during mouse development, we disrupted all three Phd genes and found that Phd2(-/-) embryos died between embryonic days 12.5 and 14.5 whereas Phd1(-/-) or Phd3(-/-) mice were apparently normal. In Phd2(-/-) mice, severe placental and heart defects preceded embryonic death. Placental defects included significantly reduced labyrinthine branching morphogenesis, widespread penetration of the labyrinth by spongiotrophoblasts, and abnormal distribution of trophoblast giant cells. The expression of several trophoblast markers was also altered, including an increase in the spongiotrophoblast marker Mash2 and decreases in the labyrinthine markers Tfeb and Gcm1. In the heart, trabeculae were poorly developed, the myocardium was remarkably thinner, and interventricular septum was incompletely formed. Surprisingly, while there were significant global increases in HIF-alpha protein levels in the placenta and the embryo proper, there was no specific HIF-alpha increase in the heart. Taken together, these data indicate that among all three PHD proteins, PHD2 is uniquely essential during mouse embryogenesis.
Figures
FIG. 1.
Generation and analyses of targeted alleles for Phd1, Phd2, and Phd3. (A) Gene targeting strategy for Phd2. In targeted Phd2 locus, exon 2 is flanked by two loxP sites. Exon 2 is deleted by Cre-mediated recombination. Ex, exon; hsv-tk, herpes simplex virus thymidine kinase; S, Sca I; H, Hind III; Neo, neomycin cassette; hatched square, Frt site (flanking the Neo cassette); open triangle, loxP site; arrows 1, 2 and 3, PCR primers for genotyping. (B to D) Southern blots for Phd1, Phd2, and Phd3 loci demonstrating the deletion of floxed exons. (E to G) PCR of genomic DNA samples to confirm the deletion of floxed exons. Different relative sizes of the mutant and wild-type bands are due to the presence or absence of the neomycin cassette. (H to J) RT-PCR analyses to confirm the lack of wild-type mRNA transcripts in _Phd1_−/−, _Phd2_−/−, and _Phd3_−/− RNA samples.
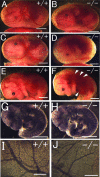
FIG. 2.
Gross morphology of _Phd2_−/− embryos. (A and B) E12.5 Phd2 +/+ and _Phd2_−/− embryos with yolk sac. (C and D) E13.5 Phd2+/+ and _Phd2_−/− embryos with yolk sac. (E and F) E13.5 Phd2+/+ and _Phd2_−/− embryos after removal of yolk sacs. _Phd2_−/− embryos were alive at E12.5 and showed normal yolk sac vasculature. At E13.5, over 70% of _Phd2_−/− embryos were already dead, with a pale yolk sac. Arrowheads indicate dark-redness. (G to J) Whole-mount PECAM-1 immunohistochemistry. E9.5 Phd2 _+/_− and _Phd2_−/− embryos (G and H). Images were captured by yolk sacs from E12.5 Phd2 _+/_− and _Phd2_−/− embryos (I and J). Scale bars, 2 mm (A to F), 500 μm (G and H), 2 mm (I and J).
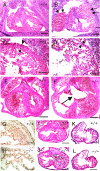
FIG. 3.
Heart defects in _Phd2_−/− embryos. (A and B) HE-stained frontal heart sections of E12.5 embryos. Both right and left atria are enlarged and congested with fetal erythrocytes in _Phd2_−/− embryo (B, arrows). (C and D) Heart sections at a higher magnification. The ventricular wall (arrowheads) is much thinner in the _Phd2_−/− heart (D) than in the Phd2 +/+ control (C). Also, trabeculae appear underdeveloped in the _Phd2_−/− section. (E and F) HE-stained horizontal heart sections at E13.0. Note the disruption of the interventricular septum in the _Phd2_−/− embryo (F, arrow). (G and H) Anti-PECAM-1 IHC of E12.5 heart sections. (I and J) HE-stained heart sections at E11.5. The ventricular wall in the _Phd2_−/− heart is only slightly thinner than in the Phd2+/+ control. (K and L) HE-stained heart sections at E10.5. Scale bars, 250 μm (A to F), 125 μm (G and H), and 250 μm (I to L).
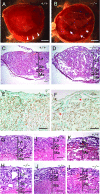
FIG. 4.
Histological analysis of placental defects in _Phd2_−/− embryos. (A and B) External appearances of Phd2 +/+ and _Phd2_−/− placentas at E12.5. In the Phd2 +/+ placenta, the edge of the labyrinth can be identified clearly (A, arrowhead). In the _Phd2_−/− placenta, the edge is vague, and patchy red spots are present (B, arrow). (C and D) HE-stained placenta sections at E12.5. Large empty spaces are clearly visible in the labyrinth layer in the _Phd2_−/− (D) but not wild-type (C) placenta. (E and F) Anti-PECAM-1 IHC of Phd2+/+ and _Phd2_−/− placentas at E12.5. Note that the large spaces (asterisks) are not lined with endothelial cells. (G to L) HE-stained placenta sections at E11.5 (G and H), E10.5 (I and J), and E9.5 (K and L). Morphological defects in the _Phd2_−/− placenta are apparent at E11.5 but much less obvious at E10.5. Sections from E9.5 placentas show no apparent difference between wild-type and _Phd2_−/− specimens. La, labyrinth; Sp, spongiotrophoblast zone; Gc, giant cells; Ma, maternal decidua. Scale bars, 1 mm (A and B), 250 μm (C and D), 125 μm (E and F), and 250 μm (G to L).
FIG. 5.
Abnormal distributions of giant cells and spongiotrophoblasts in _Phd2_−/− placentas. (A to D) HE-stained placenta sections. The box in panel D indicates the position of the image in panel B. Images in panels A and C were taken from similar areas of Phd2 +/+ and _Phd2_−/− placenta sections. Green arrowheads in panels A and B indicate examples of giant cells with both large cell bodies and intensely stained large nuclei; white arrowheads indicate giant cells with large cell bodies but faint nuclei staining; the green arrowhead in panel C indicates giant cells in the central region of a _Phd2_−/− placenta. These “giant cells” are typically smaller than their counterparts in wild-type and Phd2 _+/_− placentas, but their nuclei are still several times larger than nearby spongiotrophoblasts. Also, apparently reduced giant cell sizes were limited only to a small region near the center of the placenta, whereas the vast majority of giant cells did not appear to be different. (E to I) RNA in situ hybridization using Pl1 (E and F) and Tpbp (G to I) antisense probes. Sense probes did not display background (not shown). The orientations of the images are the same as in panel D. Both E11.5 and E10.5 sections were used for Pl1 hybridization; however, Pl1 expression was difficult to detect at E11.5 due significant down-regulation in both normal and mutant placentas by this stage. Thus, only data for E10.5 sections are shown. For Tpbp hybridization, E11.5 sections were used. Note the presence of Tpbp + cells in the labyrinth layer of the _Phd2_−/− placenta. Scale bars, 100 μm (A to C) and 1 mm (D to I).
FIG. 6.
Molecular analyses of _Phd2_−/− embryos. (A) Anti-PHD2 Western blot of total cell lysates from wild-type E7.5 to E12.5 embryos (left) or E12.5 embryos from Phd2+/− intercrosses (right). (B) Q-PCR for Phd1, Phd2, and Phd3 using wild-type E11.5 hearts. Data are shown as relative abundances to Hprt mRNA level (n = 6). (C) RT-PCR for Phd1 and Phd3 using E11.5 hearts. Hprt was used as control. (D) Western blots of embryonic nuclear extracts. Developmental stages and antibodies used are indicated in the figure. (E) Northern blots of RNA prepared from whole embryos using cDNA probes specific for Vegfa, Pgk1, _Hif-1_α, and _Hif-2_α. (F) Western blots of E11.5 embryonic heart total extracts or nuclear extracts from the remaining tissues of embryo proper after removal of the heart. Antibodies are indicated in the figure. PC, positive controls, including nuclear extract of E11.5 wild-type embryo for HIF-1α, total extracts of E11.5 wild-type placenta for HIF-2α, and CoCl2-treated NIH 3T3 cell total lysate for HIF-3α. (G) ELISA for VEGF-A in heart total lysates. Values are shown as means of protein concentration (n = 4). Genotypes in all panels refer to the Phd2 locus.
FIG. 7.
Molecular analyses of _Phd2_−/− placentas. (A) Anti-PHD2 Western blot of cell lysates of E10.5 placentas. (B) Q-PCR for Phd1, Phd2, and Phd3 mRNAs in wild-type E10.5 placentas. Values were normalized against Hprt level and are shown as means ± SEMs (n = 6). (C) Phd1 and Phd3 RT-PCR for E10.5 placentas. (D) Anti-HIF-1α and -HIF-2α Western blots of E10.5 placental cell extracts. (E) Vegfa Q-PCR for E10.5 placentas. Data are shown as means ± SEMs (n = 4). NS, not significant. (F) Northern blot of E10.5 placenta using Vegfa cDNA as a probe. (G) Q-PCR for trophoblast markers (indicated in the figure) in E10.5 placentas. **, P < 0.01; *, P < 0.05; NS, not significant (n = 12). Genotypes in all panels refer to the Phd2 locus.
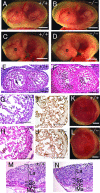
FIG. 8.
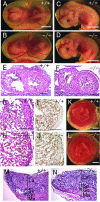
Morphological analysis of _Phd1_−/− embryos and placentas at E12.5. (A and B) Embryos with yolk sacs. (C and D) Embryos after removal of yolk sacs. (E and F) HE-stained frontal heart sections. (G and H) Higher magnification of panels E and F. (I and J) Anti-PECAM-1 IHC staining of heart sections, showing similar ventricular wall thickness and trabeculae development in wild-type and _Phd1_−/− embryos. (K and L) External appearance of placentas. In both wild-type and _Phd1_−/− placentas, the labyrinth zones are nearly a uniform red and have well-defined boundaries. (M and N) HE-stained placenta sections. Scale bars, 2 mm (A to D), 250 μm (E and F), 125 μm (G to J), 1 mm (K and L), and 250 μm (M and N).
FIG. 9.
Morphological analysis of _Phd3_−/− embryos and placentas at E12.5. (A and B) Embryos with yolk sacs. (C and D) Embryos after removal of yolk sacs. (E and F) HE-stained frontal heart sections. (G and H) Heart sections at higher magnifications. (I and J) Anti-PECAM-1 IHC staining of heart sections. (K to N) External appearances (K and L) and HE-stained sections of Phd3 +/+ and _Phd3_−/− placentas. No obvious differences can be found. Scale bars, 2 mm (A to D), 250 μm (E and F), 125 μm (G to J), 1 mm (K and L), and 250 μm (M and N).
Similar articles
- Essential role for prolyl hydroxylase domain protein 2 in oxygen homeostasis of the adult vascular system.
Takeda K, Cowan A, Fong GH. Takeda K, et al. Circulation. 2007 Aug 14;116(7):774-81. doi: 10.1161/CIRCULATIONAHA.107.701516. Epub 2007 Jul 23. Circulation. 2007. PMID: 17646578 - Role and regulation of prolyl hydroxylase domain proteins.
Fong GH, Takeda K. Fong GH, et al. Cell Death Differ. 2008 Apr;15(4):635-41. doi: 10.1038/cdd.2008.10. Epub 2008 Feb 15. Cell Death Differ. 2008. PMID: 18259202 Review. - Neuron-specific prolyl-4-hydroxylase domain 2 knockout reduces brain injury after transient cerebral ischemia.
Kunze R, Zhou W, Veltkamp R, Wielockx B, Breier G, Marti HH. Kunze R, et al. Stroke. 2012 Oct;43(10):2748-56. doi: 10.1161/STROKEAHA.112.669598. Epub 2012 Aug 28. Stroke. 2012. PMID: 22933585 - Age-dependent increase of prolyl-4-hydroxylase domain (PHD) 3 expression in human and mouse heart.
Rohrbach S, Simm A, Pregla R, Franke C, Katschinski DM. Rohrbach S, et al. Biogerontology. 2005;6(3):165-71. doi: 10.1007/s10522-005-7950-9. Biogerontology. 2005. PMID: 16041620 - HIF-prolyl hydroxylases and cardiovascular diseases.
Sen Banerjee S, Thirunavukkarasu M, Tipu Rishi M, Sanchez JA, Maulik N, Maulik G. Sen Banerjee S, et al. Toxicol Mech Methods. 2012 Jun;22(5):347-58. doi: 10.3109/15376516.2012.673088. Toxicol Mech Methods. 2012. PMID: 22424133 Review.
Cited by
- The Role of a Neurovascular Signaling Pathway Involving Hypoxia-Inducible Factor and Notch in the Function of the Central Nervous System.
Kim S, Lee M, Choi YK. Kim S, et al. Biomol Ther (Seoul). 2020 Jan 1;28(1):45-57. doi: 10.4062/biomolther.2019.119. Biomol Ther (Seoul). 2020. PMID: 31484285 Free PMC article. Review. - Hypoxia-dependent sequestration of an oxygen sensor by a widespread structural motif can shape the hypoxic response--a predictive kinetic model.
Schmierer B, Novák B, Schofield CJ. Schmierer B, et al. BMC Syst Biol. 2010 Oct 18;4:139. doi: 10.1186/1752-0509-4-139. BMC Syst Biol. 2010. PMID: 20955552 Free PMC article. - Regulation of adult erythropoiesis by prolyl hydroxylase domain proteins.
Takeda K, Aguila HL, Parikh NS, Li X, Lamothe K, Duan LJ, Takeda H, Lee FS, Fong GH. Takeda K, et al. Blood. 2008 Mar 15;111(6):3229-35. doi: 10.1182/blood-2007-09-114561. Epub 2007 Dec 4. Blood. 2008. PMID: 18056838 Free PMC article. - Somatic inactivation of the PHD2 prolyl hydroxylase causes polycythemia and congestive heart failure.
Minamishima YA, Moslehi J, Bardeesy N, Cullen D, Bronson RT, Kaelin WG Jr. Minamishima YA, et al. Blood. 2008 Mar 15;111(6):3236-44. doi: 10.1182/blood-2007-10-117812. Epub 2007 Dec 20. Blood. 2008. PMID: 18096761 Free PMC article. - Function of IRE1 alpha in the placenta is essential for placental development and embryonic viability.
Iwawaki T, Akai R, Yamanaka S, Kohno K. Iwawaki T, et al. Proc Natl Acad Sci U S A. 2009 Sep 29;106(39):16657-62. doi: 10.1073/pnas.0903775106. Epub 2009 Sep 15. Proc Natl Acad Sci U S A. 2009. PMID: 19805353 Free PMC article.
References
- Appelhoff, R. J., Y. M. Tian, R. R. Raval, H. Turley, A. L. Harris, C. W. Pugh, P. J. Ratcliffe, and J. M. Gleadle. 2004. Differential function of the prolyl hydroxylases PHD1, PHD2, and PHD3 in the regulation of hypoxia-inducible factor. J. Biol. Chem. 279:38458-38465. - PubMed
- Bruick, R. K., and S. L. McKnight. 2001. A conserved family of prolyl-4-hydroxylases that modify HIF. Science 294:1337-1340. - PubMed
Publication types
MeSH terms
Substances
LinkOut - more resources
Full Text Sources
Other Literature Sources
Medical
Molecular Biology Databases

