Ca2+ store depletion causes STIM1 to accumulate in ER regions closely associated with the plasma membrane - PubMed (original) (raw)
Ca2+ store depletion causes STIM1 to accumulate in ER regions closely associated with the plasma membrane
Minnie M Wu et al. J Cell Biol. 2006.
Abstract
Stromal interacting molecule 1 (STIM1), reported to be an endoplasmic reticulum (ER) Ca(2+) sensor controlling store-operated Ca(2+) entry, redistributes from a diffuse ER localization into puncta at the cell periphery after store depletion. STIM1 redistribution is proposed to be necessary for Ca(2+) release-activated Ca(2+) (CRAC) channel activation, but it is unclear whether redistribution is rapid enough to play a causal role. Furthermore, the location of STIM1 puncta is uncertain, with recent reports supporting retention in the ER as well as insertion into the plasma membrane (PM). Using total internal reflection fluorescence (TIRF) microscopy and patch-clamp recording from single Jurkat cells, we show that STIM1 puncta form several seconds before CRAC channels open, supporting a causal role in channel activation. Fluorescence quenching and electron microscopy analysis reveal that puncta correspond to STIM1 accumulation in discrete subregions of junctional ER located 10-25 nm from the PM, without detectable insertion of STIM1 into the PM. Roughly one third of these ER-PM contacts form in response to store depletion. These studies identify an ER structure underlying store-operated Ca(2+) entry, whose extreme proximity to the PM may enable STIM1 to interact with CRAC channels or associated proteins.
Figures
Figure 1.
STIM1 accumulates near the plasma membrane before CRAC channels open. (A) Jurkat cell expressing GFP-STIM1 imaged by TIRF microscopy during whole-cell recording with a pipette solution containing 1 mM EGTA. As stores become depleted, GFP-STIM1 redistributes into puncta near the plasma membrane as shown at the indicated times. (B) CRAC currents elicited by voltage ramps from −122 to +50 mV during the image acquisitions shown in A. Data were corrected for the leak current recorded at t = 0 s and expressed relative to cell size (capacitance). (C) Time courses of ICRAC development (measured at −122 mV) and GFP-STIM1 fluorescence (averaged across the entire cell footprint). (D) To compare the time courses of ICRAC activation and GFP-STIM1 fluorescence, the data from C were normalized to the same minimum and maximum values. (E) Accumulation of GFP-STIM1 near the plasma membrane precedes CRAC channel activation. The difference in times for ICRAC and GFP-STIM1 fluorescence to reach 20% of their maximum values is plotted for individual cells in response to passive depletion during whole-cell recording (left) or IP3-induced Ca2+ release during perforated-patch recording (right). IP3-induced Ca2+ release was triggered by cross-linking TCR with anti-CD3 mAb. The individual latencies (open circles; n = 5 cells) and mean latency (black bar) of 10 ± 2.5 s during passive depletion was comparable to the individual latencies (open squares; n = 4 cells) and mean latency (black bar) of 6.2 ± 1.8 s during IP3-induced Ca2+ release. The difference in the means was not statistically significant (t test: P = 0.28). The complete image and ICRAC sequences for A–D are shown in Video 2 (available at
http://www.jcb.org/cgi/content/full/jcb.200604014/DC1
). An individual cell response to TCR cross-linking is shown in Fig. S1.
Figure 2.
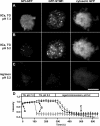
GFP-STIM1 puncta in store-depleted cells are intracellular. Three Jurkat cells expressing GPI-GFP, GFP-STIM1, or cytosolic GFP were imaged at 20-s intervals by TIRF microscopy. The images in A–C were collected at the time points indicated by the arrows in D. (A) Cells were pretreated for 10–15 min with 0-Ca2+ Ringer's solution and 1 μM TG, pH 7.3, to deplete Ca2+ stores and redistribute GFP-STIM1 into puncta. (B) Perfusion with pH 5.2 solution immediately quenches the GPI-GFP fluorescence without changing GFP-STIM1 and cytosolic GFP fluorescence. (C) GFP-STIM1 and cytosolic GFP are quenched by the pH 5.2 solution only in the presence of nigericin and monensin, which permeabilize the cells and equilibrate the intracellular and extracellular pH. (D) The time course of mean fluorescence changes for cells expressing GPI-GFP (open circles; n = 7), GFP-STIM1 (closed circles; n = 5), or cytosolic GFP (open triangles; n = 3). Values are normalized to fluorescence at t = 100 s. The complete image sequence for the experiment in A–C is shown in Video 3 (available at
http://www.jcb.org/cgi/content/full/jcb.200604014/DC1
). Bar, 5 μm.
Figure 3.
GFP-STIM1 colocalizes with an ER marker in control and store-depleted cells. Jurkat cells coexpressing GFP-STIM1 and the ER marker DsRed2-ER were imaged with TIRF microscopy before (A–C) and after (D–F) store depletion. In cells bathed in control Ringer's solution, GFP-STIM1 (A) colocalized with the ER marker (B) as shown in the merged image (C). In cells treated with 0-Ca2+ Ringer's containing 1 μM TG for 5 min to deplete Ca2+ stores, GFP-STIM1 redistributed into puncta near the plasma membrane (D). The GFP-STIM1 puncta also overlapped with DsRed2-ER (E) as shown in the merged image (F). Similar results were seen in 13 out of 13 cells. Bars, 5 μm.
Figure 4.
Store depletion drives STIM1 puncta formation without bulk ER movement toward the plasma membrane. TIRF images of a Jurkat cell coexpressing GFP-STIM1 and DsRed2-ER before and after store depletion. The images shown were collected at the times indicated by the arrows in C. Treatment with 1 μM TG in 0-Ca2+ Ringer's solution depleted Ca2+ stores and caused GFP-STIM1 to redistribute from a diffuse ER localization into bright puncta near the plasma membrane (A) without a significant increase in DsRed2-ER fluorescence (B). (C) After store depletion, GFP-STIM1 fluorescence (closed squares) increased without a corresponding increase in DsRed2-ER fluorescence (open circles) in the same cells (n = 14). Bar, 5 μm.
Figure 5.
Ultrastructural localization of ER in Jurkat cells before and after store depletion. Jurkat cells were transiently transfected with HRP-ER plasmid and processed for HRP cytochemistry and EM. (A and B) In resting cells with full Ca2+ stores, HRP-ER was located in the nuclear envelope and numerous cytoplasmic tubules (arrowheads), as well as in tubules closely associated with the plasma membrane (arrows). Large, round electron-dense structures (asterisks) were present in HRP-expressing cells as well as in untransfected cells, indicating that they are probably DAB-reactive peroxisomes or lysosomes. (C and D) In cells treated with 1 μM TG for 15 min to deplete stores, the overall distribution of HRP-ER was similar to that of resting cells, with dense reaction product present in both cytosolic and plasma membrane–associated tubules. The area outlined by the box in C is shown at higher magnification in D. n, nucleus; pm, plasma membrane. Bars: (A and C) 2 μm; (B and D) 200 nm.
Figure 6.
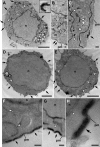
Ultrastructural localization of HRP-STIM1 in control and store-depleted Jurkat cells. (A–C) In resting cells with full Ca2+ stores, HRP-STIM1 was localized in tubules throughout the cytoplasm, having a similar distribution as tubules marked by HRP-ER (Fig. 5, A and B). (D–H) In cells treated with 1 μM TG for 15 min to deplete stores, HRP-STIM1 was concentrated in tubules closely associated with the plasma membrane (arrows), whereas weak, diffuse staining was observed in cytoplasmic ER tubules (arrowheads). m, mitochondrion; n, nucleus; pm, plasma membrane. Bars: (A, D, and E) 2 μm; (A [inset], B, C, F, and G) 200 nm; (H) 100 nm.
Figure 7.
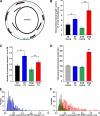
Store depletion enhances junctional contacts between the ER and the plasma membrane. Quantitative analysis of EM data from experiments like those in Figs. 5 and 6. (A) For each section where a nucleus was clearly visible, the lengths (red dashed lines) of all HRP-containing tubules located within 50 nm of the plasma membrane (green dotted line) were measured. (B) The total length of junctional HRP-tubules per section (normalized to the plasma membrane circumference) was averaged in HRP-ER–expressing cells with full (black; n = 17 cell sections) or depleted stores (blue; n = 15) and in HRP-STIM1–expressing cells with full (green; n = 16) or depleted stores (red; n = 21). The total length of junctional contacts increased after store depletion (t test: *, P = 0.02; **, P = 0.007). HRP-STIM1 overexpression did not significantly change the amount of junctional ER in resting cells (black vs. green). (C) Store depletion also increased the number of junctional contact sites (as measured by the number per micrometer of plasma membrane; t test: *, P = 0.006; **, P = 0.02). (D) Store depletion significantly increased the mean junctional tubule length in HRP-STIM1–expressing cells (ANOVA: **, P = 10−29; gray, n = 183 tubules; blue, n = 228; green, n = 133; red, n = 288; a total of 832 tubule lengths from 69 micrographs of cell sections were measured). (E) The distributions of the lengths of junctional HRP-ER tubules in resting cells (gray) and store-depleted cells (blue) were similar. (F) The lengths of junctional HRP-STIM1 tubules increased after store depletion (green, control; red, store depleted). All error bars show SEM. PM, plasma membrane.
Similar articles
- The elementary unit of store-operated Ca2+ entry: local activation of CRAC channels by STIM1 at ER-plasma membrane junctions.
Luik RM, Wu MM, Buchanan J, Lewis RS. Luik RM, et al. J Cell Biol. 2006 Sep 11;174(6):815-25. doi: 10.1083/jcb.200604015. J Cell Biol. 2006. PMID: 16966423 Free PMC article. - Oligomerization of STIM1 couples ER calcium depletion to CRAC channel activation.
Luik RM, Wang B, Prakriya M, Wu MM, Lewis RS. Luik RM, et al. Nature. 2008 Jul 24;454(7203):538-42. doi: 10.1038/nature07065. Epub 2008 Jul 2. Nature. 2008. PMID: 18596693 Free PMC article. - Nanoscale patterning of STIM1 and Orai1 during store-operated Ca2+ entry.
Perni S, Dynes JL, Yeromin AV, Cahalan MD, Franzini-Armstrong C. Perni S, et al. Proc Natl Acad Sci U S A. 2015 Oct 6;112(40):E5533-42. doi: 10.1073/pnas.1515606112. Epub 2015 Sep 8. Proc Natl Acad Sci U S A. 2015. PMID: 26351694 Free PMC article. - Remodelling of the endoplasmic reticulum during store-operated calcium entry.
Shen WW, Frieden M, Demaurex N. Shen WW, et al. Biol Cell. 2011 Aug;103(8):365-80. doi: 10.1042/BC20100152. Biol Cell. 2011. PMID: 21736554 Review. - Some assembly required: constructing the elementary units of store-operated Ca2+ entry.
Wu MM, Luik RM, Lewis RS. Wu MM, et al. Cell Calcium. 2007 Aug;42(2):163-72. doi: 10.1016/j.ceca.2007.03.003. Epub 2007 May 11. Cell Calcium. 2007. PMID: 17499354 Free PMC article. Review.
Cited by
- Missense mutation in immunodeficient patients shows the multifunctional roles of coiled-coil domain 3 (CC3) in STIM1 activation.
Maus M, Jairaman A, Stathopulos PB, Muik M, Fahrner M, Weidinger C, Benson M, Fuchs S, Ehl S, Romanin C, Ikura M, Prakriya M, Feske S. Maus M, et al. Proc Natl Acad Sci U S A. 2015 May 12;112(19):6206-11. doi: 10.1073/pnas.1418852112. Epub 2015 Apr 27. Proc Natl Acad Sci U S A. 2015. PMID: 25918394 Free PMC article. - Calcium influx through CRAC channels controls actin organization and dynamics at the immune synapse.
Hartzell CA, Jankowska KI, Burkhardt JK, Lewis RS. Hartzell CA, et al. Elife. 2016 Jul 21;5:e14850. doi: 10.7554/eLife.14850. Elife. 2016. PMID: 27440222 Free PMC article. - Differential roles of the C and N termini of Orai1 protein in interacting with stromal interaction molecule 1 (STIM1) for Ca2+ release-activated Ca2+ (CRAC) channel activation.
Zheng H, Zhou MH, Hu C, Kuo E, Peng X, Hu J, Kuo L, Zhang SL. Zheng H, et al. J Biol Chem. 2013 Apr 19;288(16):11263-72. doi: 10.1074/jbc.M113.450254. Epub 2013 Feb 27. J Biol Chem. 2013. PMID: 23447534 Free PMC article. - Phosphorylation of Stim1 at serine 575 via netrin-2/Cdo-activated ERK1/2 is critical for the promyogenic function of Stim1.
Lee HJ, Bae GU, Leem YE, Choi HK, Kang TM, Cho H, Kim ST, Kang JS. Lee HJ, et al. Mol Biol Cell. 2012 Apr;23(7):1376-87. doi: 10.1091/mbc.E11-07-0634. Epub 2012 Feb 1. Mol Biol Cell. 2012. PMID: 22298426 Free PMC article. - Gene disruption of the calcium channel Orai1 results in inhibition of osteoclast and osteoblast differentiation and impairs skeletal development.
Robinson LJ, Mancarella S, Songsawad D, Tourkova IL, Barnett JB, Gill DL, Soboloff J, Blair HC. Robinson LJ, et al. Lab Invest. 2012 Jul;92(7):1071-83. doi: 10.1038/labinvest.2012.72. Epub 2012 Apr 30. Lab Invest. 2012. PMID: 22546867 Free PMC article.
References
- Ahmari, S.E., J. Buchanan, and S.J. Smith. 2000. Assembly of presynaptic active zones from cytoplasmic transport packets. Nat. Neurosci. 3:445–451. - PubMed
- Baumann, O., and B. Walz. 2001. Endoplasmic reticulum of animal cells and its organization into structural and functional domains. Int. Rev. Cytol. 205:149–214. - PubMed
- Berridge, M. 2004. Conformational coupling: a physiological calcium entry mechanism. Sci. STKE. 2004:pe33. - PubMed
Publication types
MeSH terms
Substances
Grants and funding
- T32 AI007290/AI/NIAID NIH HHS/United States
- GM007276/GM/NIGMS NIH HHS/United States
- T32 GM007276/GM/NIGMS NIH HHS/United States
- R01 GM045374/GM/NIGMS NIH HHS/United States
- R37 GM045374/GM/NIGMS NIH HHS/United States
- 5T32AI07290-21/AI/NIAID NIH HHS/United States
- GM45374/GM/NIGMS NIH HHS/United States
LinkOut - more resources
Full Text Sources
Other Literature Sources
Miscellaneous


