Cathepsins B, L and D in inflammatory bowel disease macrophages and potential therapeutic effects of cathepsin inhibition in vivo - PubMed (original) (raw)
Cathepsins B, L and D in inflammatory bowel disease macrophages and potential therapeutic effects of cathepsin inhibition in vivo
K Menzel et al. Clin Exp Immunol. 2006 Oct.
Abstract
The cathepsins D (CTSD), B (CTSB) and L (CTSL) are important for the intracellular degradation of proteins. Increased cathepsin expression is associated with inflammatory diseases. We have shown previously an induction of CTSD expression in intestinal macrophages (IMAC) in inflamed mucosa of patients with inflammatory bowel disease (IBD). Here we investigated the regulation of CTSB and CTSL in IMAC during IBD and effects of CTSD and CTSB/CTSL inhibition in vivo. Human IMAC were isolated from normal and inflamed mucosa. Reverse transcription-polymerase chain reaction (RT-PCR) was performed for CTSB and CTSL mRNA. Immunostaining was used to confirm PCR results. Cathepsin inhibition was investigated in the dextran-sulphate-sodium (DSS) colitis model in mice with application of pepstatin A (CTSD inhibitor), CA-074 (CTSB inhibitor) and Z-Phe-Tyr-aldehyde (CTSL inhibitor). CTSL mRNA was significantly up-regulated in IMAC isolated from IBD mucosa. Up-regulated protein expression was found mainly in areas of mucosal damage by immunostaining. Inhibition of CTSD in mouse DSS colitis was followed by an amelioration of the disease. Inhibitor-treated mice showed a significant lower histological score (HS) and less colon reduction in comparison to controls. Similarly, simultaneous inhibition of CTSB/CTSL was followed by a significant amelioration of colitis. Expression of tissue-degrading cathepsins is increased in IMAC in IBD. Inhibition of CTSD as well as CTSB/CTSL is followed by an amelioration of experimental colitis. The prevention of mucosal damage by cathepsin inhibition could represent a new approach for the therapy of IBD.
Figures
Fig. 1
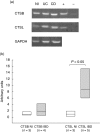
(a) Cathepsins B and L mRNA expression in CD33-positive intestinal macrophages (IMAC) from a patient with non-inflamed (NI) mucosa and two patients with inflammatory bowel disease (IBD) [ulcerative colitis (UC), Crohn's disease (CD)]. Reverse transcription–polymerase chain reaction (RT–PCR) for CTSB, CTSL and glyceraldehyde-3-phosphate dehydrogenase (GAPDH) as indicated. Positive control (+): gel extraction of digested CTSB or CTSL DNA fragment; negative control (–): without DNA. This experiment was performed three times independently with IMAC of different patients each. (b) Analysis of CTSB and CTSL expression in IMACs from control patients (NI) and from IBD patients. mRNA was isolated from IMAC of mucosal specimens, reverse transcribed and amplified by _Taq_man®–PCR. Cathepsin/GAPDH mRNA ratio (arbitrary units) as indicated. Every box consists of mean values of triple mRNA quantification of each patient. The number of patients tested is indicated. Both CTSB and CTSL expression was detected in IMAC from control patients and from patients with IBD. A significant increased expression of CTSL in IBD was demonstrated (*P < 0·05). A tendency for a higher expression of CTSB in IBD was seen.
Fig. 2
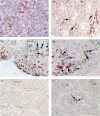
Detection of cathepsin L (CTSL)-expressing cells in human intestinal mucosa by immunohistochemistry. CTSL-positive cells were visualized with NovaRED (brown) and the macrophage marker CD68 with benzidine dihydrochloride (BDHC) (blue reaction product). (a) Single-stained CTSL-positive cells (brown) in control mucosa. Cells were counterstained with haematoxylin. (b–e) CTSL (brown) could be co-localized with macrophages (blue) in the mucosa of a control patient (b), a patient with ulcerative colitis (UC) (c, d) and a patient with Crohn's disease (CD) (e). Black arrows indicate double-stained cells. CTSL-positive macrophages were accumulated in areas of severe inflammation and tissue damage (c, e). (f) Isotype control (non-inflamed mucosa). (g) Single stained macrophages (blue) in control mucosa. No immunostaining (brown) was detected with CTSL isotype control antibody in the first immunostaining step. Original magnification 200 × (a, b, c, f) and 400 × (d, e, g). The figure is representative of two additional experiments.
Fig. 3
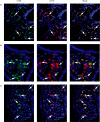
Immunofluorescent detection of cathepsin B (CTSB)-expressing cells in human intestinal mucosa from non-inflamed (NI) patients and patients with inflammatory bowel disease (IBD). Paraffin-embedded sections were fluorescently single- and double-stained for CTSB (green), macrophage-specific CD68 (red) and diamidinophenylindole (DAPI). CTSB expressing intestinal macrophages (IMAC) were detectable in mucosa from a NI patient (a), from a patient with ulcerative colitis (b) and a patient with Crohn's disease (c). White arrows indicate double-stained cells. Original magnification 400 ×. The figure is representative for two additional experiments.
Fig. 4
Weight course of inhibitor treated mice versus PBS treated control mice. Weights are indicated for only the first 7 days of the experiment because of misleading shifts in the weight curves from day 8 resulting from dying or advanced killing of four mice. The arrow indicates the first dose of pepstatin A. Datapoints are mean values of each group ± standard error of the mean (n = 5). The weight course of the dextran–sulphate–sodium/phosphate-buffered saline (DSS/PBS) group showed significant differences versus the DSS/pepstatin A group (variance analysis, P < 0·001) as well as versus the H2O/pepstatin A group (variance analysis, P = 0·006).
Fig. 5
Colon lengths of pepstatin A-treated mice (triangles) and phosphate-buffered saline (PBS)-treated mice (circles) with and without experimental colitis. The horizontal line indicates the mean values. Apart from the dextran–sulphate–sodium/PBS group that contained four mice each group consisted of five mice (*P = 0·039).
Fig. 6
Histological appearance of colitis in mice induced by treatment with dextran–sulphate–sodium. Pepstatin A-treated colitis mice developed an inflammation according to a histological score (HS) of 2·1 ± 0·8 (grey triangles) while the phosphate-buffered saline (PBS)-treated control group showed an inflammation according to 3·6 ± 0·5 (severe inflammation, black circles). Mice without colitis but treated with inhibitor (dark grey triangles) and PBS-treated controls (grey circles) did not develop an inflammation. Horizontal lines indicate mean values of each group. Scoring was performed blinded by an independent person (F. O.) (*P < 0·03).
Fig. 7
Photomicrographs of adjacent sections of murine colon tissue stained with haematoxylin and eosin (H&E). (a) Colon section of a dextran–sulphate–sodium (DSS)-colitis mouse treated with phosphate-buffered saline (PBS); (b) colon section of a DSS-colitis mouse treated with pepstatin A; (c) colon of a mouse receiving pure water and treated with pepstatin A; (d) colon of a mouse receiving pure water and treated with PBS. A dramatic reduction of mucosal thickening, lymph follicles enlargement and inflammatory cells accumulation is found in pepstatin A-treated mice. Magnification 100 ×.
Fig. 8
Weight course of inhibitor-treated mice versus phosphate-buffered saline (PBS)-treated control mice. Inhibition of cathepsin B (CTSB) and CTSL was performed intraperitoneally simultaneously with 5 mg/kg CA-074 for CTSB and Z-Phe-Tyr-aldehyde for CTSL given daily over 7 days. The arrow indicates the first dose of inhibitors. Inhibitor-treated mice (open circles) showed a significantly lower weight loss versus the PBS-treated control group (filled circles) (variance analysis, P < 0·01). Datapoints are mean values of each group ± standard error of the mean (n = 5).
Fig. 9
Colon lengths of cathepsin B (CTSB)- and CTSL-inhibitor-treated mice (open circles) and phosphate-buffered saline (PBS)-treated control mice (filled circles). The horizontal line indicates the median value of each group (*P = 0·048).
Fig. 10
(a) Histological scores (HS) of inhibitor treated mice and phosphate-buffered saline (PBS)-treated mice with and without experimental colitis. Inhibitor-treated dextran–sulphate–sodium (DSS)-colitis mice had a HS of 1·8 ± 1·3 while the PBS-treated control group showed a HS of 3·5 ± 0·5 (severe inflammation). Horizontal lines indicate the mean values of each group (n = 5). Scoring was performed blinded by an independent person (F. O.) (*P = 0·029). (b) Photomicrographs of adjacent sections of murine colon tissue stained with haematoxylin and eosin. (i) Colon section of a DSS-colitis mouse treated with PBS. The colitis is characterized by a thickening of the mucosa, large lymph follicles and an influx of inflammatory cells. (ii) colon section of a DSS-colitis mouse treated with inhibitors. Magnification 100 ×; m, intestinal mucosa; f, lymph follicle.
Similar articles
- Cathepsin D is up-regulated in inflammatory bowel disease macrophages.
Hausmann M, Obermeier F, Schreiter K, Spottl T, Falk W, Schölmerich J, Herfarth H, Saftig P, Rogler G. Hausmann M, et al. Clin Exp Immunol. 2004 Apr;136(1):157-67. doi: 10.1111/j.1365-2249.2004.02420.x. Clin Exp Immunol. 2004. PMID: 15030527 Free PMC article. - Prognostic impact of cysteine proteases cathepsin B and cathepsin L in pancreatic adenocarcinoma.
Niedergethmann M, Wostbrock B, Sturm JW, Willeke F, Post S, Hildenbrand R. Niedergethmann M, et al. Pancreas. 2004 Oct;29(3):204-11. doi: 10.1097/00006676-200410000-00005. Pancreas. 2004. PMID: 15367886 - Cathepsins B and L in peripheral blood mononuclear cells of pediatric acute myeloid leukemia: potential poor prognostic markers.
Jain M, Bakhshi S, Shukla AA, Chauhan SS. Jain M, et al. Ann Hematol. 2010 Dec;89(12):1223-32. doi: 10.1007/s00277-010-1012-3. Epub 2010 Jun 22. Ann Hematol. 2010. PMID: 20567828 - Cathepsin B Gene Knockout Improves Behavioral Deficits and Reduces Pathology in Models of Neurologic Disorders.
Hook G, Reinheckel T, Ni J, Wu Z, Kindy M, Peters C, Hook V. Hook G, et al. Pharmacol Rev. 2022 Jul;74(3):600-629. doi: 10.1124/pharmrev.121.000527. Pharmacol Rev. 2022. PMID: 35710131 Free PMC article. Review. - Recent discovery of natural substances with cathepsin L-inhibitory activity for cancer metastasis suppression.
Park JY, Park KM. Park JY, et al. Eur J Med Chem. 2024 Nov 5;277:116754. doi: 10.1016/j.ejmech.2024.116754. Epub 2024 Aug 8. Eur J Med Chem. 2024. PMID: 39128327 Review.
Cited by
- Protease-Activated Receptors in the Intestine: Focus on Inflammation and Cancer.
Sébert M, Sola-Tapias N, Mas E, Barreau F, Ferrand A. Sébert M, et al. Front Endocrinol (Lausanne). 2019 Oct 24;10:717. doi: 10.3389/fendo.2019.00717. eCollection 2019. Front Endocrinol (Lausanne). 2019. PMID: 31708870 Free PMC article. Review. - Proteomic characterization of four subtypes of M2 macrophages derived from human THP-1 cells.
Li P, Ma C, Li J, You S, Dang L, Wu J, Hao Z, Li J, Zhi Y, Chen L, Sun S. Li P, et al. J Zhejiang Univ Sci B. 2022 May 15;23(5):407-422. doi: 10.1631/jzus.B2100930. J Zhejiang Univ Sci B. 2022. PMID: 35557041 Free PMC article. - The Unusual Resistance of Avian Defensin AvBD7 to Proteolytic Enzymes Preserves Its Antibacterial Activity.
Bailleul G, Kravtzoff A, Joulin-Giet A, Lecaille F, Labas V, Meudal H, Loth K, Teixeira-Gomes AP, Gilbert FB, Coquet L, Jouenne T, Brömme D, Schouler C, Landon C, Lalmanach G, Lalmanach AC. Bailleul G, et al. PLoS One. 2016 Aug 25;11(8):e0161573. doi: 10.1371/journal.pone.0161573. eCollection 2016. PLoS One. 2016. PMID: 27561012 Free PMC article. - Cathepsin L, transmembrane peptidase/serine subfamily member 2/4, and other host proteases in COVID-19 pathogenesis - with impact on gastrointestinal tract.
Berdowska I, Matusiewicz M. Berdowska I, et al. World J Gastroenterol. 2021 Oct 21;27(39):6590-6600. doi: 10.3748/wjg.v27.i39.6590. World J Gastroenterol. 2021. PMID: 34754154 Free PMC article. Review. - The Impact of MicroRNAs during Inflammatory Bowel Disease: Effects on the Mucus Layer and Intercellular Junctions for Gut Permeability.
Stiegeler S, Mercurio K, Iancu MA, Corr SC. Stiegeler S, et al. Cells. 2021 Nov 30;10(12):3358. doi: 10.3390/cells10123358. Cells. 2021. PMID: 34943865 Free PMC article. Review.
References
- Caradonna L, Amati L, Magrone T, Pellegrino NM, Jirillo E, Caccavo D. Enteric bacteria, lipopolysaccharides and related cytokines in inflammatory bowel disease: biological and clinical significance. J Endotoxin Res. 2000;6:205–14. - PubMed
- Hausmann M, Kiessling S, Mestermann S, et al. Toll-like receptors 2 and 4 are up-regulated during intestinal inflammation. Gastroenterology. 2002;122:1987–2000. - PubMed
- Rogler G, Hausmann M, Spottl T. T cell co-stimulatory molecules are upregulated on intestinal macrophages from inflammatory bowel disease mucosa. Eur J Gastroenterol Hepatol. 1999;11:1105–11. - PubMed
- Ingalls RR, Arnaout MA, Delude RL, Flaherty S, Savedra R, Jr, Golenbock DT. The CD11/CD18 integrins: characterization of three novel LPS signaling receptors. Prog Clin Biol Res. 1998;397:107–17. - PubMed
Publication types
MeSH terms
Substances
LinkOut - more resources
Full Text Sources
Other Literature Sources
Miscellaneous


