Dissociable systems for gain- and loss-related value predictions and errors of prediction in the human brain - PubMed (original) (raw)
Dissociable systems for gain- and loss-related value predictions and errors of prediction in the human brain
Juliana Yacubian et al. J Neurosci. 2006.
Abstract
Midbrain dopaminergic neurons projecting to the ventral striatum code for reward magnitude and probability during reward anticipation and then indicate the difference between actual and predicted outcome. It has been questioned whether such a common system for the prediction and evaluation of reward exists in humans. Using functional magnetic resonance imaging and a guessing task in two large cohorts, we are able to confirm ventral striatal responses coding both reward probability and magnitude during anticipation, permitting the local computation of expected value (EV). However, the ventral striatum only represented the gain-related part of EV (EV+). At reward delivery, the same area shows a reward probability and magnitude-dependent prediction error signal, best modeled as the difference between actual outcome and EV+. In contrast, loss-related expected value (EV-) and the associated prediction error was represented in the amygdala. Thus, the ventral striatum and the amygdala distinctively process the value of a prediction and subsequently compute a prediction error for gains and losses, respectively. Therefore, a homeostatic balance of both systems might be important for generating adequate expectations under uncertainty. Prevalence of either part might render expectations more positive or negative, which could contribute to the pathophysiology of mood disorders like major depression.
Figures
Figure 1.
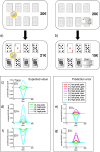
Stimulus layout for the guessing task, expected values, and associated prediction errors. a, b, Each guessing trial began with the presentation of the backside of eight playing cards (top). Initially, volunteers had to place money on individual playing cards. In some trials, money could be placed on the corners of four adjacent cards (a) and in others on a single card only (b). This manipulation allowed us to control reward probability. The cards were flipped 4.2 s after placing the bet (a, b, bottom). Seven of eight cards were black, and the remaining one was a red ace (a, b, bottom). If the red ace was selected (a), the volunteer gained the amount of money, and otherwise lost the money (b). c–g, Expected values and associated prediction errors in this paradigm. The actual values taken from Table 1 are convolved with a Gaussian for a better visual comparison with BOLD responses. The total expected value is shown in c. The gain-related expected value is depicted in d with the associated prediction error (e). The loss-related expected value is depicted in f with the associated prediction error (g). €, Euro.
Figure 2.
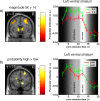
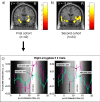
Activation during the anticipation of monetary rewards overlaid on a template T1-weighted MR image at p < 0.001 (uncorrected). Parameter estimates from the FIR model (i.e., averaged activation time courses) for each peak voxel are plotted in bins of 2 s for all 42 volunteers. The figure background shows a grayscale-coded representation of the envelope of both expected hemodynamic responses (i.e., anticipation and outcome; high values, white; low values, dark). The bright (i.e., white) area ∼12 s after stimulus onset represents the predicted peak of the response evoked by the outcome related response; the gray plateau from ∼6–10 s is related to the BOLD response elicited by reward anticipation. a, Main effect of magnitude showing stronger BOLD signal changes for trials with five Euro as opposed to one Euro. Parameter estimates from the FIR model (i.e., time courses) are averaged across outcomes and reward probability, showing a clear main effect of reward magnitude (left ventral striatum x, y, z, −12, 3, 0 mm). b, Main effect of probability showing stronger BOLD signal for trials with high reward probability. Parameter estimates from the FIR model (i.e., time courses) are averaged across reward magnitude and outcomes (left ventral striatum x, y, z, −12, 15, −3 mm). 5 €, Five Euro. R, Right side of the brain.
Figure 3.
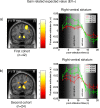
Activations expressing gain-related expected value overlaid on a template T1-weighted MR image at p < 0.001 (uncorrected). a, Bilateral ventral striatum shows BOLD signal changes covarying with a linear model of EV+. Parameter estimates from the FIR model (i.e., averaged activation time courses) for the right-sided peak (x, y, z, 12, 9, −3 mm) in 42 volunteers. b, In addition, we replicated this analysis in a second cohort of volunteers (n = 24). As in the first cohort, bilateral ventral striatum shows BOLD signal changes covarying with a linear model of EV+. The parameter estimates of the FIR model (i.e., activation time courses) are for the right-sided peak (x, y, z, 12, 9, −3 mm) for the second cohort (n = 24). R, Right side of the brain.
Figure 4.
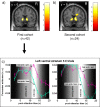
Ventral striatal activation showing EV+-related activation during anticipation and an EV+-related prediction error during outcome (conjunction analysis) overlaid on a coronal T1-weighted MR image at p < 0.001 (uncorrected). a, Bilateral ventral striatum coexpressed EV+-related predictions and the ensuing prediction error. b, This was replicated in a second cohort (n = 24). c, Parameter estimates from the FIR model (i.e., averaged activation time courses) for five-Euro trials are plotted in bins of 2 s from the peak voxel (x, y, z, −12, 6, −3 mm) for the first cohort (n = 42) (a). The gray shades in the background are pictorial representations of the expected hemodynamic responses for anticipation and outcome (compare Fig. 2). 5 €, Five Euro. R, Right side of the brain.
Figure 5.
Responses in the amygdala in relationship to loss-related expected value and the associated prediction error (conjunction analysis) at p < 0.001. a, Bilateral amygdala showed BOLD signal changes that resembled EV− during reward anticipation and an EV−-based prediction error signal during the outcome phase. b, This was replicated in a second cohort (n = 24). c, Parameter estimates from the FIR model (i.e., averaged activation time courses) for five Euro trials are shown for the right amygdala (x, y, z, 27, 0, −15) in bins of 2 s for 42 volunteers. The gray shades in the background are pictorial representations of the expected hemodynamic responses for anticipation and outcome (compare Fig. 2). 5 €, Five Euro. R, Right side of the brain.
Figure 6.
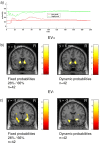
a, Dynamic probabilities during the experiment. Each point on the dashed line denotes the gain probability up to this trial for the low (red; one card selected) and high probability (green; 4 cards selected) trials. The solid line depicts the overall probability (i.e., as calculated over all trials). b, Ventral striatal activation showing EV+-related activation during anticipation and EV+-related prediction error during outcome overlaid on a coronal T1-weighted MR image at p < 0.001 (uncorrected). The left part shows the activation pattern from Figure 5_a_, using the actual gain probabilities (26 and 66%) over the course of the experiment. The right panel shows the result as obtained when using the time varying probabilities from the model depicted in a. c, The same analysis for EV−-related activation patterns (compare Fig. 5). 5 €, Five Euro. R, Right side of the brain.
Similar articles
- Temporal Specificity of Reward Prediction Errors Signaled by Putative Dopamine Neurons in Rat VTA Depends on Ventral Striatum.
Takahashi YK, Langdon AJ, Niv Y, Schoenbaum G. Takahashi YK, et al. Neuron. 2016 Jul 6;91(1):182-93. doi: 10.1016/j.neuron.2016.05.015. Epub 2016 Jun 9. Neuron. 2016. PMID: 27292535 Free PMC article. - BOLD responses reflecting dopaminergic signals in the human ventral tegmental area.
D'Ardenne K, McClure SM, Nystrom LE, Cohen JD. D'Ardenne K, et al. Science. 2008 Feb 29;319(5867):1264-7. doi: 10.1126/science.1150605. Science. 2008. PMID: 18309087 - Differential magnitude coding of gains and omitted rewards in the ventral striatum.
Pedroni A, Koeneke S, Velickaite A, Jäncke L. Pedroni A, et al. Brain Res. 2011 Sep 9;1411:76-86. doi: 10.1016/j.brainres.2011.07.019. Epub 2011 Jul 18. Brain Res. 2011. PMID: 21831362 - Involvement of basal ganglia and orbitofrontal cortex in goal-directed behavior.
Hollerman JR, Tremblay L, Schultz W. Hollerman JR, et al. Prog Brain Res. 2000;126:193-215. doi: 10.1016/S0079-6123(00)26015-9. Prog Brain Res. 2000. PMID: 11105648 Review. - Dopamine reward prediction error coding.
Schultz W. Schultz W. Dialogues Clin Neurosci. 2016 Mar;18(1):23-32. doi: 10.31887/DCNS.2016.18.1/wschultz. Dialogues Clin Neurosci. 2016. PMID: 27069377 Free PMC article. Review.
Cited by
- Neural interactions in the human frontal cortex dissociate reward and punishment learning.
Combrisson E, Basanisi R, Gueguen MCM, Rheims S, Kahane P, Bastin J, Brovelli A. Combrisson E, et al. Elife. 2024 Jun 28;12:RP92938. doi: 10.7554/eLife.92938. Elife. 2024. PMID: 38941238 Free PMC article. - Connection Failure: Differences in White Matter Microstructure Are Associated with 5-HTTLPR but Not with Risk Seeking for Losses.
Neukam PT, Müller DK, Deza-Lougovski YI, Pooseh S, Witt SH, Rietschel M, Smolka MN. Neukam PT, et al. Int J Mol Sci. 2024 Jun 18;25(12):6666. doi: 10.3390/ijms25126666. Int J Mol Sci. 2024. PMID: 38928372 Free PMC article. - Internally Formed Preferences for Options only Influence Initial Decisions in Gambling Tasks, while the Gambling Outcomes do not Alter these Preferences.
Zhu J, Katahira K, Hirakawa M, Nakao T. Zhu J, et al. J Gambl Stud. 2024 Jun 26. doi: 10.1007/s10899-024-10326-2. Online ahead of print. J Gambl Stud. 2024. PMID: 38922495 - Preexposure to one social threat alters responses to another social threat: Behavioral and electrophysiological evidence.
Fang X, Kerschreiter R, Yang YF, Niedeggen M. Fang X, et al. Cogn Affect Behav Neurosci. 2024 Feb;24(1):126-142. doi: 10.3758/s13415-023-01151-y. Epub 2024 Jan 10. Cogn Affect Behav Neurosci. 2024. PMID: 38200281 Free PMC article. - Functional connectivity between the amygdala and prefrontal cortex underlies processing of emotion ambiguity.
Sun S, Yu H, Yu R, Wang S. Sun S, et al. Transl Psychiatry. 2023 Oct 28;13(1):334. doi: 10.1038/s41398-023-02625-w. Transl Psychiatry. 2023. PMID: 37898626 Free PMC article.
References
- Abler B, Walter H, Erk S, Kammerer H, Spitzer M. Prediction error as a linear function of reward probability is coded in human nucleus accumbens. NeuroImage. 2006;31:790–795. - PubMed
- Aggleton JP. The amygdala. A functional analysis. Oxford: Oxford UP; 2000.
- Bless EP, McGinnis KA, Mitchell AL, Hartwell A, Mitchell JB. The effects of gonadal steroids on brain stimulation reward in female rats. Behav Brain Res. 1994;82:235–244. - PubMed
Publication types
MeSH terms
Substances
LinkOut - more resources
Full Text Sources
Other Literature Sources
