Reduced maternal expression of adrenomedullin disrupts fertility, placentation, and fetal growth in mice - PubMed (original) (raw)
. 2006 Oct;116(10):2653-62.
doi: 10.1172/JCI28462. Epub 2006 Sep 14.
Affiliations
- PMID: 16981008
- PMCID: PMC1564429
- DOI: 10.1172/JCI28462
Reduced maternal expression of adrenomedullin disrupts fertility, placentation, and fetal growth in mice
Manyu Li et al. J Clin Invest. 2006 Oct.
Abstract
Adrenomedullin (AM) is a multifunctional peptide vasodilator that is essential for life. Plasma AM expression dramatically increases during pregnancy, and alterations in its levels are associated with complications of pregnancy including fetal growth restriction (FGR) and preeclampsia. Using AM+/- female mice with genetically reduced AM expression, we demonstrate that fetal growth and placental development are seriously compromised by this modest decrease in expression. AM+/- female mice had reduced fertility characterized by FGR. The incidence of FGR was also influenced by the genotype of the embryo, since AM-/- embryos were more often affected than either AM+/- or AM+/+ embryos. We demonstrate that fetal trophoblast cells and the maternal uterine wall have coordinated and localized increases in AM gene expression at the time of implantation. Placentas from growth-restricted embryos showed defects in trophoblast cell invasion, similar to defects that underlie human preeclampsia and placenta accreta. Our data provide a genetic in vivo model to implicate both maternal and, to a lesser extent, embryonic levels of AM in the processes of implantation, placentation, and subsequent fetal growth. This study provides the first genetic evidence to our knowledge to suggest that a modest reduction in human AM expression during pregnancy may have an unfavorable impact on reproduction.
Figures
Figure 1. Reduced litter size in AM+/– matings.
The average number of viable offspring at postnatal day 21 and the average number of embryos at gestational day E14.5 were determined for wild-type matings (white bars) and AM+/– intercrosses (gray bars). The actual average number is recorded at the top of each bar, while the number at the bottom of the bar represents the number of litters examined for each cross. *P < 0.01 compared with wild-type crosses.
Figure 2. Reduced litter size correlates with maternal AM+/– genotype.
Reciprocal heterozygote × wild-type matings were established, and the number of viable offspring at postnatal day 21 and the average number of embryos at gestational day 14.5 were determined. The gray bars represent wild-type males crossed with AM+/–_females and the white bars represent wild-type females crossed with AM+/–_males. The actual average number for each cross is recorded at the top of each bar, while the number at the bottom of the bar represents the number of litters examined for each cross. *P < 0.01, ‡_P < 0.05 compared with the reciprocal cross; †_P < 0.01 compared with wild-type crosses (Figure 1).
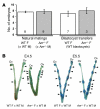
Figure 3. Abnormal implantation spacing in _AM+/–_females.
(A) Timed natural matings or blastocyst transfers were performed in wild-type (white bars) and AM+/– female mice (gray bars). The number of implanted embryos was determined between gestational stages E5.5 and E8.5. The number at the bottom of the bars represents the number of litters examined for each cross. (B) Evans blue dye injections of pregnant wild-type and AM+/– female mice at gestational stages E4.5 and E5.5 revealed comparable conceptus sizes, demonstrating that timing of implantation was conserved in AM+/– female mice. However, AM+/– female mice displayed abnormal spacing of and overcrowded conceptuses in the uterine horn (arrowheads) compared with wild-type control females.
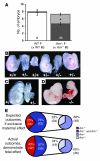
Figure 4. FGR and developmental defects correlate with placentation and fetal AM genotype.
(A) Timed matings were established for wild-type (white bar) and AM+/– crosses (dark gray bar), and viable embryos were counted for gestational stages E9.5–E12.5. Severely growth restricted or resorbed embryos were included in the total litter size and are represented by the light gray area of the bars. * P < 0.001, viable embryos from AM+/– intercrosses compared with viable embryos from wild-type crosses at the same gestational stage. (B) Representative E9.5 litter from AM+/– intercross. The genotype of each embryo is indicated below. Note that growth restriction occurred in AM+/– and AM+/+ embryos. (C) Severe growth restriction and failure of neural tube closure in an AM+/– embryo (right) compared with an AM+/+ littermate (left) isolated at E9.5. (D) Moderate growth restriction and severe heart malformations in an AM–/– embryo (right) compared with an AM+/+ littermate (left) isolated at E9.5. (E) Expected outcomes and actual outcomes for genotypes of growth-restricted or abnormal embryos expressed as a percentage of total affected embryos. The smaller pie charts only include AM+/– and _AM+/+_affected embryos. Data are representative of 35 AM+/– litters examined at E9.5, which included 97 growth-restricted or malformed embryos.
Figure 5. High incidence of morphological placental defects in AM+/– intercrosses at E9.
. (A) Saggital image of WT placental/decidual unit from E9.5 wild-type cross. Embryo and fetal membranes were removed. (B) H&E section of the sample in A, revealing fetal placental and maternal decidual tissues. (C) Normal histology of placental layers and maternal-fetal interface. (D) Saggital image of 2 placental/decidual units from E9.5 AM+/– intercross. Note the juxtaposition of implantations, with fusion of decidua and smaller size of right placental/decidual unit. The right embryo was growth restricted. (E) H&E section of another conjoined placenta unit embedded in the same juxtaposed manner as in uterus. The right sample has detached maternal-fetal interface, with invasion of the ectopic placenta from the left embryo. (F) Abnormal invasion of TGCs (arrows), small labyrinth layer, significantly reduced spongiotrophoblast layer, and almost no maternal-fetal interface are present. (G) Saggital image of placental/decidual unit with ectopic placenta that has overgrown the decidual tissue. (H and I) H&E sections through distal pole of the sample in G. Note the absence of placental layers and maternal-fetal interface and the presence of edema. (J) Rostral image of twinned placental/decidual unit from E9.5 AM+/– intercross. Note 2 fetal membranes within 1 decidua. Neither embryo appeared growth restricted. (K) H&E section through another twinned conceptus unit. Note shared decidua, 2 placentas, pool of maternal blood, and growth-restricted embryo. Genotypes were not determined. (L) Maternal-fetal interface of the sample in K. Arrows show 2 populations of TGCs invading at the same place. Pl, placenta; D, decidua; Lb, labyrinth; Sp, spongiotrophoblast. Arrows show TGCs. Scale bars: 1 mm (B, E, H, and K); 250 μm (C, F, I, and L).
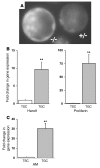
Figure 6. Fetal AM gene expression is upregulated in invasive TGCs.
(A) Fluorescence microscopy of preimplanting blastocysts generated from an AM+/– intercross and flushed from the uterine horn of an AM+/– female at E3.5. Note the strong fluorescence present in both mural and polar trophectoderm cells and a fainter signal in the inner cell mass. The left blastocyst is AM–/– and has approximately twice the intensity of fluorescence as the right AM+/– blastocyst. (B) Confirmation of TGC differentiation in a TS cell line using Hand1 and proliferin gene expression markers. Results from the quantitative RT-PCR experiment show the fold change in gene expression in differentiated TGCs compared with that in the undifferentiated TS cell culture, which was arbitrarily set at 1. (C) Quantitative measurement of AM gene expression in differentiated TGCs compared with that in the undifferentiated TS cell culture. All data were normalized to a GAPDH internal control. **P < 0.001 compared with undifferentiated TS cells.
Figure 7. Maternal uterine expression of AM is localized to implantation sites.
(A–E) In situ hybridizations for AM gene expression in consecutive serial sections of an implantation site isolated from a wild-type cross at E5. The schematic diagram depicts the approximate location of the series of sections shown in A–E, which were each approximately 150 μm apart. Note the gradual increase in maternal uterine AM gene expression that peaked at the center of the implantation site in C next to the developing embryo. (F) High-power magnification of the implantation site shown in C. Note the presence of the embryo (e) and yolk sac cavity (ys). The fetal tissue is surrounded by a thin line of intense, punctuate staining, likely representative of mural TGCs. Maternal expression of AM can be visualized in the luminal epithelium (le) and surrounding stroma (s). H&E staining of wild-type placentas at E9.5 (G) and E14.5 (I), with corresponding in situ hybridizations of serial sections (H and J, respectively) showing robust AM expression in the maternal decidua (MD) compared with weak expression in the fetal placenta (FP). m, mesometrium.
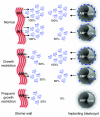
Figure 8. Effects of maternal and fetal depletion of AM in pregnancy.
In wild-type mice (Normal), AM gene expression is highly and coordinately upregulated in the maternal uterine luminal epithelium and surrounding stroma as well as fetal trophectoderm cells at the time of implantation. Due to effective gene targeting of the AM gene, AM peptide secretion is reduced by 50% in the uterine wall of heterozygote females. This modest genetic reduction results in abnormal implantation spacing, morphological defects in placentation, FGR, and subsequent reduced fertility. Implanting blastocysts from AM+/– intercrosses can be of 3 genotypes, AM+/+, AM+/–, or AM–/–, and thus they contribute different amounts of AM peptide to the implantation site: 100%, 50%, or 0% of normal, respectively. Thus, the combined effects of maternal and fetal depletion of AM result in reduced and varying concentrations of AM peptide at the implantation site. While heterozygous loss of fetal AM does not significantly affect the incidence of FGR, a greater incidence of FGR is significantly associated with _AM–/–_embryos, suggesting an essential function for the peptide during early embryonic development. ICM, inner cell mass.
Similar articles
- Uterine activin receptor-like kinase 5 is crucial for blastocyst implantation and placental development.
Peng J, Monsivais D, You R, Zhong H, Pangas SA, Matzuk MM. Peng J, et al. Proc Natl Acad Sci U S A. 2015 Sep 8;112(36):E5098-107. doi: 10.1073/pnas.1514498112. Epub 2015 Aug 24. Proc Natl Acad Sci U S A. 2015. PMID: 26305969 Free PMC article. - Adrenomedullin antagonist treatment during early gestation in rats causes fetoplacental growth restriction through apoptosis.
Penchalaneni J, Wimalawansa SJ, Yallampalli C. Penchalaneni J, et al. Biol Reprod. 2004 Nov;71(5):1475-83. doi: 10.1095/biolreprod.104.032086. Epub 2004 Jun 30. Biol Reprod. 2004. PMID: 15229133 - Defective trophoblast invasion underlies fetal growth restriction and preeclampsia-like symptoms in the stroke-prone spontaneously hypertensive rat.
Barrientos G, Pussetto M, Rose M, Staff AC, Blois SM, Toblli JE. Barrientos G, et al. Mol Hum Reprod. 2017 Jul 1;23(7):509-519. doi: 10.1093/molehr/gax024. Mol Hum Reprod. 2017. PMID: 28402512 - Fetal Growth Restriction: Does an Integrated Maternal Hemodynamic-Placental Model Fit Better?
Mecacci F, Avagliano L, Lisi F, Clemenza S, Serena C, Vannuccini S, Rambaldi MP, Simeone S, Ottanelli S, Petraglia F. Mecacci F, et al. Reprod Sci. 2021 Sep;28(9):2422-2435. doi: 10.1007/s43032-020-00393-2. Epub 2020 Nov 19. Reprod Sci. 2021. PMID: 33211274 Free PMC article. Review. - Pathophysiology of placental-derived fetal growth restriction.
Burton GJ, Jauniaux E. Burton GJ, et al. Am J Obstet Gynecol. 2018 Feb;218(2S):S745-S761. doi: 10.1016/j.ajog.2017.11.577. Am J Obstet Gynecol. 2018. PMID: 29422210 Review.
Cited by
- A historical review of blastocyst implantation research.
Yoshinaga K. Yoshinaga K. Biol Reprod. 2018 Jul 1;99(1):175-195. doi: 10.1093/biolre/ioy093. Biol Reprod. 2018. PMID: 30010858 Free PMC article. Review. - Parallel functional assessment of m6A sites in human endodermal differentiation with base editor screens.
Cheng W, Liu F, Ren Z, Chen W, Chen Y, Liu T, Ma Y, Cao N, Wang J. Cheng W, et al. Nat Commun. 2022 Jan 25;13(1):478. doi: 10.1038/s41467-022-28106-0. Nat Commun. 2022. PMID: 35078991 Free PMC article. - Fetal-derived adrenomedullin mediates the innate immune milieu of the placenta.
Li M, Schwerbrock NM, Lenhart PM, Fritz-Six KL, Kadmiel M, Christine KS, Kraus DM, Espenschied ST, Willcockson HH, Mack CP, Caron KM. Li M, et al. J Clin Invest. 2013 Jun;123(6):2408-20. doi: 10.1172/JCI67039. Epub 2013 May 1. J Clin Invest. 2013. PMID: 23635772 Free PMC article. - Haploinsufficiency for adrenomedullin reduces pinopodes and diminishes uterine receptivity in mice.
Li M, Wu Y, Caron KM. Li M, et al. Biol Reprod. 2008 Dec;79(6):1169-75. doi: 10.1095/biolreprod.108.069336. Epub 2008 Aug 20. Biol Reprod. 2008. PMID: 18716289 Free PMC article. - Decoy receptor CXCR7 modulates adrenomedullin-mediated cardiac and lymphatic vascular development.
Klein KR, Karpinich NO, Espenschied ST, Willcockson HH, Dunworth WP, Hoopes SL, Kushner EJ, Bautch VL, Caron KM. Klein KR, et al. Dev Cell. 2014 Sep 8;30(5):528-40. doi: 10.1016/j.devcel.2014.07.012. Dev Cell. 2014. PMID: 25203207 Free PMC article.
References
- Baschat A.A. Pathophysiology of fetal growth restriction: implications for diagnosis and surveillance. Obstet. Gynecol. Surv. 2004;59:617–627. - PubMed
- Anthony R.V., Scheaffer A.N., Wright C.D., Regnault T.R. Ruminant models of prenatal growth restriction. Reprod. Suppl. 2003;61:183–194. - PubMed
- Scheffen I., et al. Alterations of the fetal capillary bed in the guinea pig placenta following long-term hypoxia. Adv. Exp. Med. Biol. 1990;277:779–790. - PubMed
- Ogata E.S., Swanson S.L., Collins J.W., Finley S.L. Intrauterine growth retardation: altered hepatic energy and redox states in the fetal rat. Pediatr. Res. 1990;27:56–63. - PubMed
- Schwartz J.E., Kovach A., Meyer J., McConnell C., Iwamoto H.S. Brief, intermittent hypoxia restricts fetal growth in Sprague-Dawley rats. Biol. Neonate. 1998;73:313–319. - PubMed
Publication types
MeSH terms
Substances
Grants and funding
- R01 NS031768/NS/NINDS NIH HHS/United States
- R01 HD046970/HD/NICHD NIH HHS/United States
- HD046970/HD/NICHD NIH HHS/United States
- NS031768/NS/NINDS NIH HHS/United States
- R01 HL049277/HL/NHLBI NIH HHS/United States
- HL49277/HL/NHLBI NIH HHS/United States
LinkOut - more resources
Full Text Sources
Other Literature Sources
Medical
Molecular Biology Databases
Miscellaneous


