Nuclear import time and transport efficiency depend on importin beta concentration - PubMed (original) (raw)
Nuclear import time and transport efficiency depend on importin beta concentration
Weidong Yang et al. J Cell Biol. 2006.
Abstract
Although many components and reaction steps necessary for bidirectional transport across the nuclear envelope (NE) have been characterized, the mechanism and control of cargo migration through nuclear pore complexes (NPCs) remain poorly understood. Single-molecule fluorescence microscopy was used to track the movement of cargos before, during, and after their interactions with NPCs. At low importin beta concentrations, about half of the signal-dependent cargos that interacted with an NPC were translocated across the NE, indicating a nuclear import efficiency of approximately 50%. At high importin beta concentrations, the import efficiency increased to approximately 80% and the transit speed increased approximately sevenfold. The transit speed and import efficiency of a signal-independent cargo was also increased by high importin beta concentrations. These results demonstrate that maximum nucleocytoplasmic transport velocities can be modulated by at least approximately 10-fold by the importin beta concentration and therefore suggest a potential mechanism for regulating the speed of cargo traffic across the NE.
Figures
Figure 1.
Imaging of cargos before, during, and after their interaction with NPCs. (A) Select video frames for two ICs that interacted with the same NPC in a permeabilized HeLa cell. The large image is a false-color bright-field image showing the nucleus (N) and the cytoplasm (C). The smaller images, corresponding to the boxed region in the large image (same scale), are 2-ms video frames for a cargo molecule that transported into the nucleus (top) and for a cargo molecule that underwent abortive transport, returning to the cytoplasm (bottom). These smaller images consist of SMF signals (green) overlaid onto a bright-field image (red) obtained with the same camera. The circular laser illumination area for SMF approximately filled the boxed region. The fluorescent cargo was NLS-2xGFP(4C) labeled with four Alexa 647 molecules. Numbers correspond to time in milliseconds. [fluorescent cargo] = 0.1 nM; [Imp α] = [Imp β] = 0.5 μM; [Ran] = 2 μM; [GTP] = 1 mM; [NTF2] = 1 μM. Bar, 5 μm. (B) Trajectories for the two interaction events shown in A with all frames included. The trajectory of the cargo molecule that transported into the nucleus (entry event) is shown in red, and the trajectory of the cargo molecule that underwent abortive transport (abortive event) is shown in blue. The beginning of each trajectory is identified by an asterisk. The red curve is the experimentally determined position of the NE from the bright-field image; the green and black curves are for reference at −100 and +100 nm from the NE, respectively.
Figure 2.
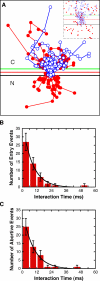
Single-molecule trajectories and interaction times for cargos that entered the nucleus and for cargos that aborted transport. (A) Alignment (see Materials and methods) of 43 trajectories from 19 NPCs (2 nuclei) under the conditions of Fig. 1. The red line is the experimentally determined position of the NE from the bright-field image; the green and black lines are for reference at −100 and +100 nm from the NE, respectively. Entry events are shown in red, and abortive events are shown in blue. N, nucleus; C, cytoplasm. (inset) Expanded view of the main figure (without lines connecting points for clarity), illustrating that cargos that underwent abortive transport appear to have had access to the same volume within the NE ± 100-nm region as the cargos that actually did transport. (B) Histogram of interaction times for cargos that entered the nucleus. τ = 8.0 ± 0.4 ms; n = 51. (C) Histogram of interaction times for cargos that underwent abortive transport. τ = 8.6 ± 0.7 ms; n = 49. For comparison, the interaction time for all observed cargos, including those for which both entry and exit compartment could not be determined, was 8.6 ± 0.4 ms (n = 264). From the n values for the interaction time calculations in B and C, the import efficiency was calculated to be 51 ± 5%.
Figure 3.
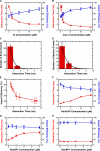
NLS–2xGFP interaction time and import efficiency dependence on the bulk IC, cargo-free Imp β, RanGAP, and RanBP1 concentrations. Unless otherwise noted, concentrations and the fluorescent cargo are the same as in Fig. 1. (A) Interaction time (red) and import efficiency (blue) dependence on IC concentration. The fluorescent cargo concentration was fixed at 0.1 nM, and the total cargo concentration was increased by adding “nonfluorescent” cargo (NLS-2xGFP[4C] with no fluorescent dye labels). At the cargo and cofactor concentrations used, >99% of the cargo was assumed to be complexed with Imp α and β (Catimel et al., 2001). Thus, the IC concentration was assumed to equal the added cargo concentration. When [IC] was ∼0.1 nM, [nonfluorescent cargo] = 0 nM and [Imp α] = [Imp β] = 0.5 μM. For all other IC concentrations, [Imp α] = [Imp β] = [nonfluorescent cargo]. (B) Interaction time (red) and import efficiency (blue) dependence on Imp β concentration. (C) Histogram of interaction times for cargos in B at 15 μM Imp β that entered the nucleus. τ = 1.0 ± 0.1 ms; n = 189. (D) Histogram of interaction times for cargos in B at 15 μM Imp β that underwent abortive transport. τ = 1.4 ± 0.1 ms; n = 42. (E) Nonlinear dependence of import efficiency on interaction time under certain conditions. The data in B were plotted to explicitly demonstrate the nonlinear relationship between import efficiency and interaction time when these values were varied by changing the Imp β concentration. (F) Interaction time (red) and import efficiency (blue) dependence on RanGAP concentration. [Imp β] = 15 μM. (G) Interaction time (red) and import efficiency (blue) dependence on RanBP1 concentration at low Imp β concentration. [Imp β] = 3 μM. [RanGAP] = 0.5 μM. (H) Interaction time (red) and import efficiency (blue) dependence on RanBP1 concentration at high Imp β concentration. [Imp β] = 15 μM. [RanGAP] = 0.5 μM.
Figure 4.
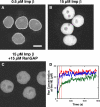
Ran accumulation in the nucleus and at the NE. (A–C) Nuclear accumulation of fluorescent Ran. Shown is the average of 101 confocal frames collected between 600 and 800 s after reaction initiation. Images were acquired under the same conditions and displayed with the same scaling. Unless noted above the images, concentrations were the same as in Fig. 1. Bar, 10 μm. (D) Time course of the NE accumulation of Ran under the conditions of A (red), B (blue), and C (green). The vertical dashed lines (red) indicate the time interval during which single-molecule transport experiments were conducted (unless otherwise noted).
Figure 5.
Imp α and β accumulation in the nucleus and at the NE. Unless noted at the top, concentrations were the same as in Fig. 1. Images shown in A–F are the average of 101 confocal frames collected between 600 and 800 s after reaction initiation. (A–C) Nuclear accumulation of fluorescent Imp β. Images were acquired under the same conditions and are displayed with the same scaling. (D–F) Nuclear accumulation of fluorescent Imp α. Images were acquired under the same conditions and are displayed with the same scaling (scaling different from A–C). Bars, 10 μm. (G) Time course of the NE accumulation of Imp β under the conditions of A (red), B (blue), and C (green). (H and I) Time course of the Imp β and α distribution under the conditions of A and D, respectively. The fluorescence intensity in the nuclear (blue), NE (red), and cytoplasmic (green) regions shows minimal NE accumulation of Imp α but significant NE accumulation of Imp β, compared with the cytoplasmic background. The estimated NE accumulation of Imp α could result primarily from the difficulty of distinguishing the nucleoplasm from the NE. The vertical dashed lines (red) in G–I indicate the time interval during which single-molecule transport experiments were conducted (unless otherwise noted).
Figure 6.
Interaction times and transport efficiencies of signal-independent cargos. Interaction times were determined in the absence of all exogeneous transport cofactors and GTP. (A) Histogram of 10-kD dextran interaction times in import buffer (no glycerol). τ = 2.2 ± 0.1; n = 170. (B) Histogram of 10-kD dextran interaction times in import buffer with 25% glycerol. τ = 2.2 ± 0.2; n = 184. (C) Histogram of rpS13 interaction times in import buffer (no glycerol). τ = 3.3 ± 0.1; n = 161. (D) Histogram of rpS13 interaction times in import buffer with 25% glycerol. τ = 3.2 ± 0.3; n = 171.
Figure 7.
10-kD dextran interaction time and import efficiency dependence on the Imp β concentration. Interaction time (red) and import efficiency (blue) of 10-kD dextran in import buffer with 25% glycerol.
Figure 8.
In vivo single-molecule nuclear import. (A) Bright-field image of two HeLa cells before microinjection. Bar, 10 μm. (B) Epifluorescence image of the two cells in A ∼3 min after cytoplasmic microinjection of NLS-2xGFP(4C). The Alexa 555–labeled cargo localized to the nuclei after microinjection. (C) Histogram of NE interaction times after microinjection of NLS-2xGFP(4C). Data were pooled from cargo tagged with Alexa 555 and cargo labeled with Alexa 647 (see Table S1, available at
http://www.jcb.org/cgi/content/full/jcb.200605053/DC1
). τ = 7.8 ± 0.4 ms (n = 307); import efficiency = 51 ± 5% (n = 115). (D) Histogram of NE interaction times after microinjection of Alexa 647 dextran (10 kD). τ = 1.8 ± 0.1 ms (n = 374); import efficiency = 50 ± 4% (n = 141).
Similar articles
- Influence of cargo size on Ran and energy requirements for nuclear protein import.
Lyman SK, Guan T, Bednenko J, Wodrich H, Gerace L. Lyman SK, et al. J Cell Biol. 2002 Oct 14;159(1):55-67. doi: 10.1083/jcb.200204163. Epub 2002 Oct 7. J Cell Biol. 2002. PMID: 12370244 Free PMC article. - The importin-beta binding domain of snurportin1 is responsible for the Ran- and energy-independent nuclear import of spliceosomal U snRNPs in vitro.
Huber J, Dickmanns A, Lührmann R. Huber J, et al. J Cell Biol. 2002 Feb 4;156(3):467-79. doi: 10.1083/jcb.200108114. Epub 2002 Jan 28. J Cell Biol. 2002. PMID: 11815630 Free PMC article. - Importin alpha can migrate into the nucleus in an importin beta- and Ran-independent manner.
Miyamoto Y, Hieda M, Harreman MT, Fukumoto M, Saiwaki T, Hodel AE, Corbett AH, Yoneda Y. Miyamoto Y, et al. EMBO J. 2002 Nov 1;21(21):5833-42. doi: 10.1093/emboj/cdf569. EMBO J. 2002. PMID: 12411501 Free PMC article. - Importin beta: conducting a much larger cellular symphony.
Harel A, Forbes DJ. Harel A, et al. Mol Cell. 2004 Nov 5;16(3):319-30. doi: 10.1016/j.molcel.2004.10.026. Mol Cell. 2004. PMID: 15525506 Review. - Structural biology of nucleocytoplasmic transport.
Cook A, Bono F, Jinek M, Conti E. Cook A, et al. Annu Rev Biochem. 2007;76:647-71. doi: 10.1146/annurev.biochem.76.052705.161529. Annu Rev Biochem. 2007. PMID: 17506639 Review.
Cited by
- Choreography of importin-α/CAS complex assembly and disassembly at nuclear pores.
Sun C, Fu G, Ciziene D, Stewart M, Musser SM. Sun C, et al. Proc Natl Acad Sci U S A. 2013 Apr 23;110(17):E1584-93. doi: 10.1073/pnas.1220610110. Epub 2013 Apr 8. Proc Natl Acad Sci U S A. 2013. PMID: 23569239 Free PMC article. - FG/FxFG as well as GLFG repeats form a selective permeability barrier with self-healing properties.
Frey S, Görlich D. Frey S, et al. EMBO J. 2009 Sep 2;28(17):2554-67. doi: 10.1038/emboj.2009.199. Epub 2009 Aug 13. EMBO J. 2009. PMID: 19680227 Free PMC article. - Intracellular trafficking and subcellular distribution of a large array of HPMA copolymers.
Callahan J, Kopečkov P, Kopeček J. Callahan J, et al. Biomacromolecules. 2009 Jul 13;10(7):1704-14. doi: 10.1021/bm801514x. Epub 2009 May 21. Biomacromolecules. 2009. PMID: 21197960 Free PMC article. - Model inspired by nuclear pore complex suggests possible roles for nuclear transport receptors in determining its structure.
Osmanović D, Ford IJ, Hoogenboom BW. Osmanović D, et al. Biophys J. 2013 Dec 17;105(12):2781-9. doi: 10.1016/j.bpj.2013.11.013. Biophys J. 2013. PMID: 24359750 Free PMC article. - Single-molecule measurements of importin alpha/cargo complex dissociation at the nuclear pore.
Sun C, Yang W, Tu LC, Musser SM. Sun C, et al. Proc Natl Acad Sci U S A. 2008 Jun 24;105(25):8613-8. doi: 10.1073/pnas.0710867105. Epub 2008 Jun 18. Proc Natl Acad Sci U S A. 2008. PMID: 18562297 Free PMC article.
References
- Bayliss, R., K. Ribbeck, D. Akin, H.M. Kent, C.M. Feldherr, D. Görlich, and M. Stewart. 1999. Interaction between NTF2 and xFxFG-containing nucleoporins is required to mediate nuclear import of RanGDP. J. Mol. Biol. 293:579–593. - PubMed
- Bischoff, F.R., and D. Görlich. 1997. RanBP1 is crucial for the release of RanGTP from importin β-related nuclear transport factors. FEBS Lett. 419:249–254. - PubMed


