Subcortical visual dysfunction in schizophrenia drives secondary cortical impairments - PubMed (original) (raw)
Subcortical visual dysfunction in schizophrenia drives secondary cortical impairments
Pamela D Butler et al. Brain. 2007 Feb.
Abstract
Visual processing deficits are an integral component of schizophrenia and are sensitive predictors of schizophrenic decompensation in healthy adults. The primate visual system consists of discrete subcortical magnocellular and parvocellular pathways, which project preferentially to dorsal and ventral cortical streams. Subcortical systems show differential stimulus sensitivity, while cortical systems, in turn, can be differentiated using surface potential analysis. The present study examined contributions of subcortical dysfunction to cortical processing deficits using high-density event-related potentials. Event-related potentials were recorded to stimuli biased towards the magnocellular system using low-contrast isolated checks in Experiment 1 and towards the magnocellular or parvocellular system using low versus high spatial frequency (HSF) sinusoidal gratings, respectively, in Experiment 2. The sample consisted of 23 patients with schizophrenia or schizoaffective disorder and 19 non-psychiatric volunteers of similar age. In Experiment 1, a large decrease in the P1 component of the visual event-related potential in response to magnocellular-biased isolated check stimuli was seen in patients compared with controls (F = 13.2, P = 0.001). Patients also showed decreased slope of the contrast response function over the magnocellular-selective contrast range compared with controls (t = 9.2, P = 0.04) indicating decreased signal amplification. In Experiment 2, C1 (F = 8.5, P = 0.007), P1 (F = 33.1, P < 0.001) and N1 (F = 60.8, P < 0.001) were reduced in amplitude to magnocellular-biased low spatial frequency (LSF) stimuli in patients with schizophrenia, but were intact to parvocellular-biased HSF stimuli, regardless of generator location. Source waveforms derived from inverse dipole modelling showed reduced P1 in Experiment 1 and reduced C1, P1 and N1 to LSF stimuli in Experiment 2, consistent with surface waveforms. These results indicate pervasive magnocellular dysfunction at the subcortical level that leads to secondary impairment in activation of cortical visual structures within dorsal and ventral stream visual pathways. Our finding of early visual dysfunction is consistent with and explanatory of classic literature showing subjective complaints of visual distortions and is consistent with early visual processing deficits reported in schizophrenia. Although deficits in visual processing have frequently been construed as resulting from failures of top-down processing, the present findings argue strongly for bottom-up rather than top-down dysfunction at least within the early visual pathway. Deficits in magnocellular processing in this task may reflect more general impairments in neuronal systems functioning, such as deficits in non-linear amplification and may thus represent an organizing principle for predicting neurocognitive dysfunction in schizophrenia.
Figures
Fig. 1
(A) Examples of isolated-check stimuli used in Experiment 1. Stimuli were presented at five different contrasts (4–64% contrast). (B) Spatial frequency stimuli used in Experiment 2. Stimuli were presented at spatial frequencies of 1 and 5 c/deg.
Fig. 2
The top plot shows the group-averaged voltage waveforms for controls (n = 16) and the bottom plot for patients (n = 22) in response to isolated checks of different luminance contrasts. Waveforms are the mean of the response at six electrode sites used for P1 in each hemisphere and C1 centrally. A pink disc indicates the location of the six electrode sites in the left hemisphere used for P1. A blue disc indicates location of the six electrodes in the right hemisphere used for P1, and a green disc indicates location of the six central electrodes used for C1.
Fig. 3
Maps of scalp voltage topography to isolated checks of 4, 16 and 64% contrast for controls (n = 16) and patients (n = 22).
Fig. 4
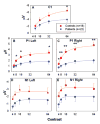
(A–E) C1, P1 and N1 amplitude at each luminance contrast for controls and patients with schizophrenia. Amplitudes are the mean of the response at six electrode sites used for P1 and N1 in each hemisphere and C1 centrally. Error bars represent the standard error of the mean for patients and controls. *P < 0.05, **P < 0.005.
Fig. 5
Group-averaged voltage waveforms for controls (n = 16) and patients (n = 18) in response to low (1 c/deg) spatial frequency (top) and high (5 c/deg) spatial frequency (bottom) gratings. Waveforms are the mean of the response at six electrode sites used for P1 and N1 in each hemisphere and C1 centrally. A pink disc indicates the location of the six electrode sites in the left hemisphere used for P1. A blue disc indicates location of the six electrodes in the right hemisphere used for P1 and a green disc indicates location of the six central electrodes used for C1.
Fig. 6
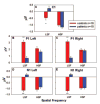
C1, P1 and N1 amplitudes to HSF and LSF stimuli for patients and controls. Amplitudes are the mean of the response at six electrode sites used for P1 and N1 in each hemisphere and C1 centrally. Error bars represent the standard error of the mean for patients and controls. *P < 0.05, **P < 0.001.
Fig. 7
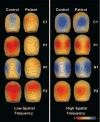
Voltage topography maps of responses of controls (n = 16) and patients (n = 18) to low (1 c/deg) and high (5 c/deg) spatial frequency gratings. The amplitude of the C1 component was maximal at 94 ms, the P1 component at 138 ms, the N1 component at 186 ms and the P2 component at 262 ms.
Fig. 8
Anatomical localization of modelled dipoles and derived source waveforms. The dipoles and derived source waveforms were obtained at 64% contrast for Experiment 1 and at LSF and HSF for Experiment 2 in patients and controls.
Comment in
- A few remarks on assessing magnocellular sensitivity in Schizophrenic patients.
Skottun BC, Skoyles J. Skottun BC, et al. Brain. 2007 Nov;130(Pt 11):e83; author reply e84. doi: 10.1093/brain/awm153. Epub 2007 Jul 12. Brain. 2007. PMID: 17627964 No abstract available.
Similar articles
- Impairments in generation of early-stage transient visual evoked potentials to magno- and parvocellular-selective stimuli in schizophrenia.
Schechter I, Butler PD, Zemon VM, Revheim N, Saperstein AM, Jalbrzikowski M, Pasternak R, Silipo G, Javitt DC. Schechter I, et al. Clin Neurophysiol. 2005 Sep;116(9):2204-15. doi: 10.1016/j.clinph.2005.06.013. Clin Neurophysiol. 2005. PMID: 16055375 Free PMC article. Clinical Trial. - Early-stage visual processing and cortical amplification deficits in schizophrenia.
Butler PD, Zemon V, Schechter I, Saperstein AM, Hoptman MJ, Lim KO, Revheim N, Silipo G, Javitt DC. Butler PD, et al. Arch Gen Psychiatry. 2005 May;62(5):495-504. doi: 10.1001/archpsyc.62.5.495. Arch Gen Psychiatry. 2005. PMID: 15867102 Free PMC article. - Dysfunction of early-stage visual processing in schizophrenia.
Butler PD, Schechter I, Zemon V, Schwartz SG, Greenstein VC, Gordon J, Schroeder CE, Javitt DC. Butler PD, et al. Am J Psychiatry. 2001 Jul;158(7):1126-33. doi: 10.1176/appi.ajp.158.7.1126. Am J Psychiatry. 2001. PMID: 11431235 - On the use of spatial frequency to isolate contributions from the magnocellular and parvocellular systems and the dorsal and ventral cortical streams.
Skottun BC. Skottun BC. Neurosci Biobehav Rev. 2015 Sep;56:266-75. doi: 10.1016/j.neubiorev.2015.07.002. Epub 2015 Jul 16. Neurosci Biobehav Rev. 2015. PMID: 26188134 Review. - A few remarks on attention and magnocellular deficits in schizophrenia.
Skottun BC, Skoyles JR. Skottun BC, et al. Neurosci Biobehav Rev. 2008;32(1):118-22. doi: 10.1016/j.neubiorev.2007.06.002. Epub 2007 Jun 27. Neurosci Biobehav Rev. 2008. PMID: 17651801 Review.
Cited by
- Magnocellular projections as the trigger of top-down facilitation in recognition.
Kveraga K, Boshyan J, Bar M. Kveraga K, et al. J Neurosci. 2007 Nov 28;27(48):13232-40. doi: 10.1523/JNEUROSCI.3481-07.2007. J Neurosci. 2007. PMID: 18045917 Free PMC article. - Is Attentional Filtering Impaired in Schizophrenia?
Luck SJ, Leonard CJ, Hahn B, Gold JM. Luck SJ, et al. Schizophr Bull. 2019 Sep 11;45(5):1001-1011. doi: 10.1093/schbul/sbz045. Schizophr Bull. 2019. PMID: 31206163 Free PMC article. Review. - From basic perception deficits to facial affect recognition impairments in schizophrenia.
Marosi C, Fodor Z, Csukly G. Marosi C, et al. Sci Rep. 2019 Jun 20;9(1):8958. doi: 10.1038/s41598-019-45231-x. Sci Rep. 2019. PMID: 31222063 Free PMC article. - Comprehensive analysis of a novel mouse model of the 22q11.2 deletion syndrome: a model with the most common 3.0-Mb deletion at the human 22q11.2 locus.
Saito R, Koebis M, Nagai T, Shimizu K, Liao J, Wulaer B, Sugaya Y, Nagahama K, Uesaka N, Kushima I, Mori D, Maruyama K, Nakao K, Kurihara H, Yamada K, Kano M, Fukada Y, Ozaki N, Aiba A. Saito R, et al. Transl Psychiatry. 2020 Feb 5;10(1):35. doi: 10.1038/s41398-020-0723-z. Transl Psychiatry. 2020. PMID: 32066675 Free PMC article.
References
- Alain C, Hargrave R, Woods DL. Processing of auditory stimuli during visual attention in patients with schizophrenia. Biol Psychiatry. 1998;44:1151–9. - PubMed
- Allison T, Puce A, Spencer D, McCarthy G. Electrophysiological studies of human face perception I: potentials generated in occipitotemporal cortex by face and non-face stimuli. Cereb Cortex. 1999;9:415–30. - PubMed
- Ardekani BA, Nierenberg J, Hoptman MJ, Javitt DC, Lim KO. MRI study of white matter diffusion anisotropy in schizophrenia. Neuroreport. 2003;14:2025–9. - PubMed
- Bar M. A cortical mechanism for triggering top-down facilitation in visual object recognition. J Cogn Neurosci. 2003;15:600–9. - PubMed
- Barch DM, Mathews JR, Buckner RL, Maccotta L, Csernansky JG, Snyder AZ. Hemodynamic responses in visual, motor, and somatosensory cortices in schizophrenia. Neuroimage. 2003;20:1884–93. - PubMed
Publication types
MeSH terms
Grants and funding
- R37 MH49334/MH/NIMH NIH HHS/United States
- R01 MH065350/MH/NIMH NIH HHS/United States
- R01 MH65350/MH/NIMH NIH HHS/United States
- R37 MH049334/MH/NIMH NIH HHS/United States
- K02 MH001439/MH/NIMH NIH HHS/United States
- MH66374/MH/NIMH NIH HHS/United States
- R03 MH067579/MH/NIMH NIH HHS/United States
- WT_/Wellcome Trust/United Kingdom
- R01 MH066374/MH/NIMH NIH HHS/United States
- K02 MH01439/MH/NIMH NIH HHS/United States
LinkOut - more resources
Full Text Sources
Other Literature Sources
Medical


