Increased level of polyploidy1, a conserved repressor of CYCLINA2 transcription, controls endoreduplication in Arabidopsis - PubMed (original) (raw)
Increased level of polyploidy1, a conserved repressor of CYCLINA2 transcription, controls endoreduplication in Arabidopsis
Takeshi Yoshizumi et al. Plant Cell. 2006 Oct.
Abstract
Endoreduplication is a type of cell cycle in which DNA replication continues without cell division. We have isolated several dominant mutants from Arabidopsis thaliana activation tagging lines by flow cytometry. One of the mutants, increased level of polyploidy1-1D (ilp1-1D), showed increased polyploidy in both light- and dark-grown hypocotyls. The corresponding gene of ilp1-1D encodes a protein homologous to the C-terminal region of mammalian GC binding factor. We demonstrate that this protein functions as a transcriptional repressor in vivo. The expression of all members of the CYCLINA2 (CYCA2) family was reduced in an ILP1 overexpressing line, and the mouse (Mus musculus) homolog of ILP1 repressed cyclin A2 expression in mouse NIH3T3 cells. T-DNA insertion mutants of ILP1 showed reduced polyploidy and upregulated all CYCA2 expression. Furthermore, loss of CYCA2;1 expression induces an increase in polyploidy in Arabidopsis. We demonstrate that this protein regulates endoreduplication through control of CYCA2 expression in Arabidopsis.
Figures
Figure 1.
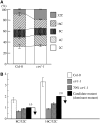
Categories Used for Dominant Polyploid Mutant Screening. (A) Relative ratio of each cell ploidy of the wild type (Col-0) and ctr1-1. Approximately 5000 nuclei were counted in the wild type and ctr1-1 mutant. (B) Ratio of 8C/32C and 16C/32C of dark-grown seedlings of the wild type (Col-0), ctr1-1, and a mixture of Col-0 and ctr1-1 at a ratio of 3 to 7. Black bars indicate the categories used for mutant screening. For each ploidy measurement, at least 20 seedlings were used, and it was replicated three times. Error bars indicate standard deviation.
Figure 2.
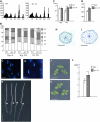
Ploidy Levels Were Highly Increased in Dark- and Light-Grown ilp1-1D Seedlings. (A) Histograms of ploidy levels of hypocotyl cells of 7-d-old dark-grown seedlings. Left panel, wild type; right panel, homozygous ilp1-1D; x axis, nuclear ploidy; y axis, cell count. Approximately 5000 nuclei were counted in the wild type and ilp1-1D. (B) Relative ratio of each cell ploidy of dark- and light-grown wild type and ilp1-1D. At least 20 seedlings were used for ploidy analysis, and it was replicated three times. Hyp. D, hypocotyl cells of dark-grown seedlings; Hyp. WL, hypocotyl cells of light-grown seedlings; Cot. WL, cotyledon cells of light-grown seedlings. Approximately 3000 to 5000 nuclei were counted in the wild type and ilp1-1D. (C) and (D) DAPI staining of nuclei of the lower part of the hypocotyl of the wild type (C) and ilp1-1D (D). (E) Morphology of 7-d-old dark-grown seedlings of the wild type (two left seedlings) and ilp1-1D (two right seedlings). Arrowheads indicate the junction of hypocotyl and root. (F) Hypocotyl and root length of 7-d-old dark-grown wild-type and ilp1-1D seedlings. (G) Diameter of hypocotyls of 7-d-old dark-grown wild-type and ilp1-1D seedlings. (H) and (I) Transverse sections of dark-grown hypocotyls of the wild type (H) and ilp1-1D (I). (J) and (K) Cotyledons of 7-d-old light-grown seedlings of the wild type (J) and ilp1-1D (K). (L) Cotyledonal areas of 7-d-old light-grown wild-type and ilp1-1D seedlings. At least 20 seedlings were measured in (F), (G), and (L). Bars in (B), (F), (G), and (L) indicate standard deviation. Bars = 10 μm in (C) and (D), 5 mm in (E), (J), and (K), and 100 μm in (H) and (I). Student's t test: * 0.001 > P versus the wild type in (F), (G), and (L).
Figure 3.
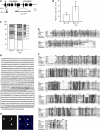
Cloning and Characterization of the ILP1 Gene. (A) T-DNA insertion sites in ilp1-1D. The triangle with bar indicates the activation-tagging T-DNA insertion site in ilp1-1D. Black lines on bar indicate the four copies of the CaMV 35S enhancer near the right border. Small white and gray triangles indicate the T-DNA insertion sites of ilp1-1 (SALK_030650) and ilp1-2 (SALK_135563), respectively. Arrowheads indicate primer positions for real-time PCR in Figures 3B and 6C and Supplemental Figure 2B online, and arrows indicate primer positions for semiquantitative RT-PCR in Figure 4B. (B) Real-time PCR analysis showing expression of AT5g08550 (ILP1) in the wild type (Col-0), ilp1-1D, and _ILP1-_ox. Relative expression levels: expression levels of the ILP1 genes in ilp1-1D and AT5g08550 (ILP1) overexpressing line (#2) (_ILP1_-ox) relative to the wild type. Error bars indicate standard deviation. (C) Relative ratio of each cell ploidy of dark-grown wild type (Col-0) and _ILP1-_ox (#2). Approximately 5000 nuclei were counted in the wild type and _ILP1_-ox. (D) Amino acid sequence of ILP1 protein. Box with dashed line indicates motif 1, and box with solid line indicates motif 2. Underlined bold letters indicate putative NLS. (E) Alignment of ILP1 motif 1 and its homologs. The ILP1 motif 1 was aligned with similar regions of other proteins: Arabidopsis, human, mouse, and human GCF1. The amino acid identity and similarity between the ILP1 motif 1 and its homologs are 38 and 42% for Arabidopsis, 27 and 48% for human, 27 and 48% for mouse, and 28 and 52% for human GCF1. (F) Alignment of ILP1 motif 2 and its homologs. Motif 2 was aligned with similar regions of other proteins; Arabidopsis, human, mouse, Drosophila, human GCF1, and C. elegans. All alignments were performed using ClustalW and Mac Boxshade software. The amino acid identity and similarity between ILP1 motif 2 and its homologs are 72 and 77% for Arabidopsis, 27 and 45% for human, 27 and 44% for mouse, 28 and 48% for Drosophila, 22 and 43% for human GCF1, and 25 and 44% for C. elegans. For (E) and (F), gray letters indicate functionally conserved amino acid residues in at least three members. White letters with black background indicate conserved amino acid residues in all members. (G) Localization of ILP1:GFP. Left panel indicates fluorescence of ILP1:GFP. Right panel is a DAPI-stained nuclear image. Arrowheads indicate nuclei. The experiment was repeated three times.
Figure 4.
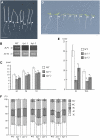
Loss of ILP1 Function Decreases Polyploidy Levels. (A) Morphology of dark-grown wild type, ilp1-1, and ilp1-2. Seedlings were grown for 5 d. Each pair of seedlings from left to right is wild type, ilp1-1, heterozygotes of ilp1-1 and ilp1-2, and ilp1-2, respectively. Isogenic wild-type siblings of ilp1-1 were used as the wild type. The same result was obtained from wild-type siblings of ilp1-2. Arrowheads indicate the junction of hypocotyl and root. (B) Semiquantitative RT-PCR for the expression of ILP1. Number on the left indicates cycles of PCR. ACT2 was used as a control. (C) Hypocotyl length of 3-, 5-, and 7-d-old dark-grown wild-type, ilp1-1, and ilp1-2 seedlings. (D) Seven-day-old light-grown seedlings of the wild type, ilp1-1, and ilp1-2. Alignment of seedlings is same as in (A). Arrowheads indicate the junction of hypocotyl and root. (E) Root length of 7-d-old dark- and light-grown wild type, ilp1-1, and ilp1-2. D, darkness; WL, white light. (F) Relative ratio of each cell ploidy of 3-, 5-, and 7-d-old dark-grown wild-type, ilp1-1, and ilp1-2 homozygotes. Approximately 3000 nuclei were counted in the wild type, ilp1-1, and ilp1-2. Bars in (A) and (D) = 5 mm. Error bars in (C), (E), and (F) indicate standard deviation. Student's t test: * 0.001 > P versus the wild type in (C) and (E). At least 20 seedlings were measured in (C) and (E).
Figure 5.
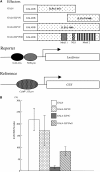
ILP1 Functions as a Transcriptional Repressor in Plant Cells. (A) The constructs used for the in vivo transcription assay. GAL4-ILP1N, GAL4 DNA binding domain (GAL4DB) is fused to the N-terminal region of ILP1 (residues 1 to 567); GAL4-ILP1C, GAL4DB is fused to the C-terminal region of ILP (residues 474 to 908); GAL4ILP1Full, GAL4DB is fused to the full-length ILP1. The reporter plasmid contains a GAL4 binding site and 0.2 kb of the nopaline synthase promoter (NOS-pro) upstream of the LUC reporter gene. The reference plasmid serves to monitor the transformation efficiency by β-glucuronidase (GUS) expression controlled by a constitutive CaMV 35S promoter. (B) In vivo transcription assay in tobacco leaves. LUC/GUS ratio: LUC expression (reporter) was normalized with GUS expression (reference). Error bars indicate standard error. The experiment was repeated five times.
Figure 6.
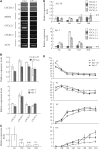
ILP1 Represses CYCA2 Expression in Arabidopsis. (A) Semiquantitative RT-PCR analysis of cell cycle–specific genes. CYCD3;1, HISH4, CYCA2;1, and CYCB1;2 are G1-, S-, G2-, and M-phase-specific markers, respectively. ACT2 was used as a control. Numbers on left side indicate cycles of PCR. (B) Real-time PCR analysis of CYCA2 gene family members. Expression levels of the CYCA2 family genes were normalized with ACT2 expression. Relative expression levels: expression levels of the CYCA2 genes in each mutant line and an _ILP1_-ox line relative to the wild type. RNA was isolated from 7-d-old dark-grown hypocotyls of ilp1-1D and _ILP1-_ox (top panel) and from 3-d-old dark-grown hypocotyls of ilp1-1 and ilp1-2 (bottom panel). The experiment was repeated four times. (C) Real-time PCR analysis of ILP1 in the wild type (Col-0). The numbers indicate ILP1 expression relative to day 8. The experiment was repeated four times. (D) Real-time PCR analysis of CYCA2 gene family members in first leaves of ilp1-1D and ilp1-2 at four developmental stages. Expression levels of the CYCA2 family genes were normalized with ACT2 expression. Relative expression levels: expression levels of the CYCA2 genes in each mutant line relative to the wild type. CYCA2;1 expression was not detected in the wild type and ilp1-1D after day 12. The experiment was repeated four times. (E) Ploidy distribution patterns of first leaves of the wild type, ilp1-1D, and ilp1-2 at several developmental stages. The fraction of each ploidy was plotted as wild type (open circle), ilp1-1D (open square), and ilp1-2 (closed triangle). Isogenic wild-type siblings of ilp1-1D were used as the wild type. The same result was obtained from wild-type siblings of ilp1-2. The experiment was repeated three times. Error bars in (B) to (E) indicate standard deviation.
Figure 7.
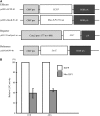
ILP1 Represses Ccna2 Expression in Mouse NIH3T3 Cells. (A) The constructs used for the in vivo transcription assay in mouse NIH3T3 cells. pcDNA-ECFP-40 contains the enhanced cyan fluorescent protein (ECFP) gene and was used as a control, and pcDNA-MusILP1-40 contains the mouse ILP1 cDNA (731 amino acids). The reporter plasmid consists of the Ccna2 promoter region (−177 to +100 bp of the transcriptional start site) fused to the LUC gene. The reference plasmid serves to monitor the transfection efficiency by β-galactosidase (LacZ) expression. CMV pro, Cytomegalovirus promoter; BGH pA, bovine growth hormone polyadenylation site. (B) In vivo transcription assay in mouse NIH3T3 cells. LUC activity was normalized with β-galactosidase activity. Relative LUC activity: LUC activity of mouse ILP1 relative to enhanced cyan fluorescent protein. Activities were measured 24 and 48 h after transfection. Error bars indicate standard deviation. The experiment was repeated four times.
Figure 8.
Loss of CYCA2;1 Reduced Polyploidy Level. (A) Loci of T-DNA insertions in CYCA2;1. Triangles indicate insertion sites of T-DNAs of cyca2;1-1 (SALK_121077) and cyca2;1-2 (SALK_136750). (B) Semiquantitative RT-PCR analysis of CYCA2;1. Numbers on left side indicate cycles of PCR. (C) Relative ratio of each cell ploidy of dark- and light-grown wild-type, cyca2;1-1, and cyca2;1-2 homozygotes. Hyp. D, hypocotyl cells of dark-grown seedlings; Hyp. WL, hypocotyl cells of light-grown seedlings; Cot. WL, cotyledon cells of dark-grown seedlings. Isogenic wild-type siblings of cyca2;1-1 were used as the wild type. The same result was obtained from wild-type siblings of cyca2;1-2. Approximatley 3000 nuclei were counted in the wild type, cyca2;1-1, and cyca2;1-2. Error bars indicate standard deviation.
Similar articles
- Light-dependent polyploidy control by a CUE protein variant in Arabidopsis.
Tsumoto Y, Yoshizumi T, Kuroda H, Kawashima M, Ichikawa T, Nakazawa M, Yamamoto N, Matsui M. Tsumoto Y, et al. Plant Mol Biol. 2006 Jul;61(4-5):817-28. doi: 10.1007/s11103-006-0053-4. Plant Mol Biol. 2006. PMID: 16897495 - The A-type cyclin CYCA2;3 is a key regulator of ploidy levels in Arabidopsis endoreduplication.
Imai KK, Ohashi Y, Tsuge T, Yoshizumi T, Matsui M, Oka A, Aoyama T. Imai KK, et al. Plant Cell. 2006 Feb;18(2):382-96. doi: 10.1105/tpc.105.037309. Epub 2006 Jan 13. Plant Cell. 2006. PMID: 16415207 Free PMC article. - Analysis of a sugar response mutant of Arabidopsis identified a novel B3 domain protein that functions as an active transcriptional repressor.
Tsukagoshi H, Saijo T, Shibata D, Morikami A, Nakamura K. Tsukagoshi H, et al. Plant Physiol. 2005 Jun;138(2):675-85. doi: 10.1104/pp.104.057752. Epub 2005 May 13. Plant Physiol. 2005. PMID: 15894743 Free PMC article. - The Arabidopsis KAKTUS gene encodes a HECT protein and controls the number of endoreduplication cycles.
El Refy A, Perazza D, Zekraoui L, Valay JG, Bechtold N, Brown S, Hülskamp M, Herzog M, Bonneville JM. El Refy A, et al. Mol Genet Genomics. 2003 Dec;270(5):403-14. doi: 10.1007/s00438-003-0932-1. Epub 2003 Oct 7. Mol Genet Genomics. 2003. PMID: 14530964 - The transcription factor ATAF2 represses the expression of pathogenesis-related genes in Arabidopsis.
Delessert C, Kazan K, Wilson IW, Van Der Straeten D, Manners J, Dennis ES, Dolferus R. Delessert C, et al. Plant J. 2005 Sep;43(5):745-57. doi: 10.1111/j.1365-313X.2005.02488.x. Plant J. 2005. PMID: 16115070
Cited by
- Fruit size control by a zinc finger protein regulating pericarp cell size in tomato.
Zhao F, Zhang J, Weng L, Li M, Wang Q, Xiao H. Zhao F, et al. Mol Hortic. 2021 Aug 14;1(1):6. doi: 10.1186/s43897-021-00009-6. Mol Hortic. 2021. PMID: 37789485 Free PMC article. - TEB/POLQ plays dual roles in protecting Arabidopsis from NO-induced DNA damage.
Lv Q, Han S, Wang L, Xia J, Li P, Hu R, Wang J, Gao L, Chen Y, Wang Y, Du J, Bao F, Hu Y, Xu X, Xiao W, He Y. Lv Q, et al. Nucleic Acids Res. 2022 Jul 8;50(12):6820-6836. doi: 10.1093/nar/gkac469. Nucleic Acids Res. 2022. PMID: 35736216 Free PMC article. - Isolation of Lineage Specific Nuclei Based on Distinct Endoreduplication Levels and Tissue-Specific Markers to Study Chromatin Accessibility Landscapes.
Karaaslan ES, Faiß N, Liu C, Berendzen KW. Karaaslan ES, et al. Plants (Basel). 2020 Nov 3;9(11):1478. doi: 10.3390/plants9111478. Plants (Basel). 2020. PMID: 33153046 Free PMC article. - Spliceosome disassembly factors ILP1 and NTR1 promote miRNA biogenesis in Arabidopsis thaliana.
Wang J, Chen S, Jiang N, Li N, Wang X, Li Z, Li X, Liu H, Li L, Yang Y, Ni T, Yu C, Ma J, Zheng B, Ren G. Wang J, et al. Nucleic Acids Res. 2019 Sep 5;47(15):7886-7900. doi: 10.1093/nar/gkz526. Nucleic Acids Res. 2019. PMID: 31216029 Free PMC article. - SnRK1 Kinase and the NAC Transcription Factor SOG1 Are Components of a Novel Signaling Pathway Mediating the Low Energy Response Triggered by ATP Depletion.
Hamasaki H, Kurihara Y, Kuromori T, Kusano H, Nagata N, Yamamoto YY, Shimada H, Matsui M. Hamasaki H, et al. Front Plant Sci. 2019 May 10;10:503. doi: 10.3389/fpls.2019.00503. eCollection 2019. Front Plant Sci. 2019. PMID: 31134102 Free PMC article.
References
- Alonso, J.M., et al. (2003). Genome-wide insertional mutagenesis of Arabidopsis thaliana. Science 301 653–657. - PubMed
- Boudolf, V., Vlieghe, K., Beemster, G.T., Magyar, Z., Torres Acosta, J.A., Maes, S., Van Der Schueren, E., Inze, D., and De Veylder, L. (2004). The plant-specific cyclin-dependent kinase CDKB1;1 and transcription factor E2Fa-DPa control the balance of mitotically dividing and endoreduplicating cells in Arabidopsis. Plant Cell 16 2683–2692. - PMC - PubMed
- Burssens, S., de Almeida Engler, J., Beeckman, T., Richard, C., Shaul, O., Ferreira, P., Van Montagu, M., and Inzé, D. (2000). Developmental expression of the Arabidopsis thaliana CycA2;1 gene. Planta 211 623–631. - PubMed
Publication types
MeSH terms
Substances
LinkOut - more resources
Full Text Sources
Other Literature Sources
Molecular Biology Databases
Miscellaneous
