Atg22 recycles amino acids to link the degradative and recycling functions of autophagy - PubMed (original) (raw)
Atg22 recycles amino acids to link the degradative and recycling functions of autophagy
Zhifen Yang et al. Mol Biol Cell. 2006 Dec.
Abstract
In response to stress conditions (such as nutrient limitation or accumulation of damaged organelles) and certain pathological situations, eukaryotic cells use autophagy as a survival mechanism. During nutrient stress the main purpose of autophagy is to degrade cytoplasmic materials within the lysosome/vacuole lumen and generate an internal nutrient pool that is recycled back to the cytosol. This study elucidates a molecular mechanism for linking the degradative and recycling roles of autophagy. We show that in contrast to published studies, Atg22 is not directly required for the breakdown of autophagic bodies within the lysosome/vacuole. Instead, we demonstrate that Atg22, Avt3, and Avt4 are partially redundant vacuolar effluxers, which mediate the efflux of leucine and other amino acids resulting from autophagic degradation. The release of autophagic amino acids allows the maintenance of protein synthesis and viability during nitrogen starvation. We propose a "recycling" model that includes the efflux of macromolecules from the lysosome/vacuole as the final step of autophagy.
Figures
Figure 1.
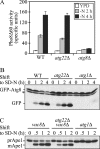
The _atg22_Δ mutant displays normal autophagy. (A) Pho8Δ60 activity, a marker for nonspecific autophagy, indicates this process is normal in _atg22_Δ cells. The Pho8Δ60-dependent alkaline phosphatase activity was measured before and 2 or 4 h after shifting from YPD to SD-N medium. The error bars indicate the SD of two independent experiments. (B) GFP-Atg8 processing is normal in the _atg22_Δ mutant. The wild-type (WT, SEY6210), _atg1_Δ (WHY1), and _atg22_Δ (ZFY6) strains expressing GFP-Atg8 were grown in SMD to mid-log phase and shifted to SD-N to induce autophagy. At the indicated times, aliquots were removed and examined by immunoblot using anti-GFP antibody. The position of free GFP, indicating autophagy-dependent processing of GFP-Atg8, is indicated. The asterisk indicates a nonspecific band. (C) In the _atg22_Δ mutant autophagic delivery of prApe1 is normal in the Cvt pathway-defective _vac8_Δ background. The _vac8_Δ (YTS178), _atg22_Δ _vac8_Δ (ZFY8), and _atg1_Δ (WHY1) strains were cultured as described above. At the indicated times, aliquots were taken and checked by immunoblot using anti-Ape1 antiserum. The positions of precursor and mature Ape1 are indicated.
Figure 2.
The _atg22_Δ mutant cells display a kinetic delay in the breakdown of autophagic bodies. (A) The _atg22_Δ (ZFY1) and _pep4_Δ (ZFY2) strains were grown to mid-log phase in YPD and shifted to SD-N medium for 4 and 6 h. Cells were fixed and then examined by electron microscopy as described in Materials and Methods. The bars in the main images (X7,900) and insets (X19,000) represent 2 and 0.5 μm, respectively. (B) Quantification of autophagic body (AB) accumulation. The number of autophagic bodies in ∼100 or 50 cells containing vacuoles of similar size in _atg22_Δ and _pep4_Δ cells, respectively, were quantified. The error bars represent the SD (C) The average number of vacuoles from the quantification in B is depicted.
Figure 3.
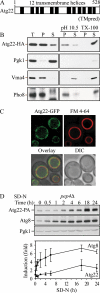
Atg22 is an integral vacuolar membrane protein. (A) Hydrophobicity analysis based on TMpred (Hofmann and Stoffel, 1993) predicts 12 transmembrane helices, which are indicated schematically. (B) Atg22 is an integral membrane protein. Cells expressing Atg22-3xHA (ZFY36) were grown in YPD, converted to spheroplasts, and osmotically lysed and fractionated into total (T), supernatant (S), and pellet (P) fractions, as described in Materials and Methods. The resulting pellet was subjected to the indicated treatment: 0.5 mM Na2CO3, pH 10.5, or 1% Triton X-100. After centrifugation, S and P fractions were collected and analyzed by immunoblots with anti-hemagglutinin (HA) antibody or the indicated antisera. The positions of Atg22-HA, and the markers Pgk1 (cytosolic), Vma4 (peripheral membrane), and Pho8 (integral membrane) are indicated. (C) Atg22 is localized on the vacuolar membrane. Cells expressing Atg22-GFP (ZFY16) were grown in YPD, treated with FM 4-64 to label vacuoles, and analyzed by fluorescence microscopy as described in Materials and Methods. DIC, differential interference contrast. (D) The expression level of Atg22 seemed constant under vegetative growth and was induced under nitrogen starvation conditions. Cells expressing Atg22-protein A (ZFY38) in the background of _pep4_Δ were grown in YPD and shifted to SD-N. At the indicated times, aliquots were removed and analyzed by immunoblot using anti-protein A (PA) antibody and antisera to Atg8 and Pgk1; Pgk1 was used as a loading control. The blot is shown for a representative experiment and the graph plots the data for three independent experiments. The error bars represent the SD.
Figure 4.
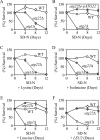
_atg22_Δ mutant cells displayed a loss of viability in starvation conditions. The wild-type (SEY6210), _atg22_Δ (ZFY6), and _atg1_Δ (WHY1) cells were grown in SMD containing auxotrophic amino acids and nucleosides to OD600 = 1.0, and then they were shifted to SD-N. The SD-N included no addition (A), 30 μg/ml lysine (C), 30 μg/ml isoleucine (D), and 50 μg/ml leucine (E). Cells harbored the plasmid pCu-ATG22, expressing Atg22 from the CUP1 promoter (B), or the pRS425 (LEU2) plasmid (F). At the indicated day, viability was determined by removing aliquots, plating on YPD in triplicate, and counting the number of colonies per plate after 2–3 d of growth. The addition of leucine, or the LEU2 or ATG22 genes restored viability of _atg22_Δ cells to wild-type levels. The addition of histidine or uracil resulted in essentially the same loss of viability as seen with lysine. The error bars indicate the SD of two independent experiments.
Figure 5.
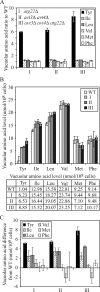
Yeast vacuoles accumulated a high level of tyrosine, isoleucine, and leucine in the absence of Atg22 and/or Avt3/Avt4. The wild-type (SEY6210), _atg22_Δ (ZFY6), _avt3_Δ _avt4_Δ (ZFY20), and _avt3_Δ _avt4_Δ _atg22_Δ (ZFY22) cells were grown in YPD medium and harvested at log phase. The preparation of vacuolar amino acid pools and analysis of amino acid composition are described in Materials and Methods. The results represent the mean and SD of three experiments. The amino acid concentration was normalized to the highest concentration of arginine among three experiments. The results are displayed as the ratio to wild type (A), the absolute values expressed as nanomoles/108 cells (B), and the difference from wild type for tyrosine, isoleucine, leucine, valine, methionine, and phenylalanine for the wild-type, _atg22_Δ (I), _avt3_Δ _avt4_Δ (II), and _avt3_Δ _avt4_Δ _atg22_Δ (III) strains (C). Tyrosine, isoleucine, and leucine accumulated in the mutants, compared with the controls valine, methionine, and phenylalanine. The table lists the vacuolar amino acid levels shown in the graph in B.
Figure 6.
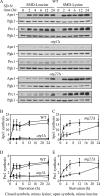
Protein synthesis dependent upon autophagic amino acids was partially defective in _atg22_Δ mutant cells. (A) The wild-type (SEY6210), _atg1_Δ (WHY1), and _atg22_Δ (ZFY6) cells were grown in SMD and then shifted to SMD-leucine or SMD-lysine to induce autophagy. At the indicated incubation time, aliquots were removed and cell lysates (1.0 OD600 unit of cells) were analyzed by immunoblot with antiserum against Ape1, Prc1, and Pgk1. Pgk1 was used as a loading control. (B–E) Quantification of immunoblots from SMD-leucine (open symbols) or SMD-lysine (closed symbols) in the wild-type (square), _atg1_Δ (circle), and _atg22_Δ (triangle) cells. Band intensities were quantified using NIH Image 1.62 (by Wayne Rasband, National Institutes of Health, Bethesda. MD). The data are the average of three independent experiments and the error bars indicate the SD.
Figure 7.
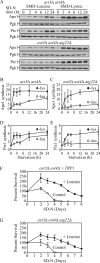
Protein synthesis and survival dependent on autophagic amino acids was reduced in _avt3_Δ _avt4_Δ mutant cells, and the defect was exacerbated by the _atg22_Δ mutation. (A) _avt3_Δ _avt4_Δ (ZFY20) and _avt3_Δ _avt4_Δ _atg22_Δ (ZFY22) cells were grown and analyzed for up-regulated protein synthesis as described in the legend to Figure 6. (B–E) Quantification of immunoblots from SMD-leucine (open symbols) or SMD-lysine (closed symbols) in the _avt3_Δ _avt4_Δ (square), or _avt3_Δ _avt4_Δ _atg22_Δ (circle) cells. Band intensities were quantified as described in the legend to Figure 6. The loss of leucine effluxers blocked synthesis of Ape1 and Prc1 during leucine depletion. The _avt3_Δ _avt4_Δ strain harboring pRS414 (TRP1) (F) and _avt3_Δ _avt4_Δ _atg22_Δ (G) cells were grown in SMD to mid-log phase and incubated in SD-N or SD-N containing 100 μg/ml leucine. At the indicated days, viability was determined as described in the legend to Figure 4. The error bars indicate the SD of three independent experiments. The reduced viability of the _avt3_Δ _avt4_Δ, and _avt3_Δ _avt4_Δ _atg22_Δ mutant cells was partially rescued by addition of leucine.
Figure 8.
Model for autophagy including the final step of amino acid efflux. Autophagy is depicted as occurring in five discrete stages as shown. Additional steps including cargo recognition, vesicle nucleation, and retrieval of Atg proteins have been omitted for simplicity. See the text for a discussion of the role of efflux.
Similar articles
- Permeases recycle amino acids resulting from autophagy.
Yang Z, Klionsky DJ. Yang Z, et al. Autophagy. 2007 Mar-Apr;3(2):149-50. doi: 10.4161/auto.3631. Epub 2007 Mar 28. Autophagy. 2007. PMID: 17204852 - Vacuolar transporter Avt4 is involved in excretion of basic amino acids from the vacuoles of Saccharomyces cerevisiae.
Sekito T, Chardwiriyapreecha S, Sugimoto N, Ishimoto M, Kawano-Kawada M, Kakinuma Y. Sekito T, et al. Biosci Biotechnol Biochem. 2014;78(6):969-75. doi: 10.1080/09168451.2014.910095. Epub 2014 Jun 13. Biosci Biotechnol Biochem. 2014. PMID: 25036121 - Membrane protein recycling from the vacuole/lysosome membrane.
Suzuki SW, Emr SD. Suzuki SW, et al. J Cell Biol. 2018 May 7;217(5):1623-1632. doi: 10.1083/jcb.201709162. Epub 2018 Mar 6. J Cell Biol. 2018. PMID: 29511122 Free PMC article. - Transport of Amino Acids across the Vacuolar Membrane of Yeast: Its Mechanism and Physiological Role.
Kawano-Kawada M, Kakinuma Y, Sekito T. Kawano-Kawada M, et al. Biol Pharm Bull. 2018;41(10):1496-1501. doi: 10.1248/bpb.b18-00165. Biol Pharm Bull. 2018. PMID: 30270317 Review. - Autophagy in yeast: a review of the molecular machinery.
Huang WP, Klionsky DJ. Huang WP, et al. Cell Struct Funct. 2002 Dec;27(6):409-20. doi: 10.1247/csf.27.409. Cell Struct Funct. 2002. PMID: 12576634 Review.
Cited by
- The world's first (and probably last) autophagy video game.
Hawkins WD, Grush ER, Klionsky DJ. Hawkins WD, et al. Autophagy. 2023 Jan;19(1):352-357. doi: 10.1080/15548627.2022.2143212. Epub 2022 Nov 16. Autophagy. 2023. PMID: 36324276 Free PMC article. - Conserved regulators of Rag GTPases orchestrate amino acid-dependent TORC1 signaling.
Powis K, De Virgilio C. Powis K, et al. Cell Discov. 2016 Mar 8;2:15049. doi: 10.1038/celldisc.2015.49. eCollection 2016. Cell Discov. 2016. PMID: 27462445 Free PMC article. Review. - Functional Expression and Characterization of Schizosaccharomyces pombe Avt3p as a Vacuolar Amino Acid Exporter in Saccharomyces cerevisiae.
Chardwiriyapreecha S, Manabe K, Iwaki T, Kawano-Kawada M, Sekito T, Lunprom S, Akiyama K, Takegawa K, Kakinuma Y. Chardwiriyapreecha S, et al. PLoS One. 2015 Jun 17;10(6):e0130542. doi: 10.1371/journal.pone.0130542. eCollection 2015. PLoS One. 2015. PMID: 26083598 Free PMC article. - Topology and Function of the S. cerevisiae Autophagy Protein Atg15.
Marquardt L, Montino M, Mühe Y, Schlotterhose P, Thumm M. Marquardt L, et al. Cells. 2023 Aug 12;12(16):2056. doi: 10.3390/cells12162056. Cells. 2023. PMID: 37626866 Free PMC article.
References
- Epple U. D., Eskelinen E.-L., Thumm M. Intravacuolar membrane lysis in Saccharomyces cerevisiae. Does vacuolar targeting of Cvt17/Aut5p affect its function? J. Biol. Chem. 2003;278:7810–7821. - PubMed
Publication types
MeSH terms
Substances
LinkOut - more resources
Full Text Sources
Molecular Biology Databases
