Extrasynaptic alphabeta subunit GABAA receptors on rat hippocampal pyramidal neurons - PubMed (original) (raw)
Extrasynaptic alphabeta subunit GABAA receptors on rat hippocampal pyramidal neurons
Martin Mortensen et al. J Physiol. 2006.
Abstract
Extrasynaptic GABA(A) receptors that are tonically activated by ambient GABA are important for controlling neuronal excitability. In hippocampal pyramidal neurons, the subunit composition of these extrasynaptic receptors may include alpha5betagamma and/or alpha4betadelta subunits. Our present studies reveal that a component of the tonic current in the hippocampus is highly sensitive to inhibition by Zn(2+). This component is probably not mediated by either alpha5betagamma or alpha4betadelta receptors, but might be explained by the presence of alphabeta isoforms. Using patch-clamp recording from pyramidal neurons, a small tonic current measured in the absence of exogenous GABA exhibited both high and low sensitivity to Zn(2+) inhibition (IC(50) values, 1.89 and 223 microm, respectively). Using low nanomolar and micromolar GABA concentrations to replicate tonic currents, we identified two components that are mediated by benzodiazepine-sensitive and -insensitive receptors. The latter indicated that extrasynaptic GABA(A) receptors exist that are devoid of gamma2 subunits. To distinguish whether the benzodiazepine-insensitive receptors were alphabeta or alphabetadelta isoforms, we used single-channel recording. Expressing recombinant alpha1beta3gamma2, alpha5beta3gamma2, alpha4beta3delta and alpha1beta3 receptors in human embryonic kidney (HEK) or mouse fibroblast (Ltk) cells, revealed similar openings with high main conductances (approximately 25-28 pS) for gamma2 or delta subunit-containing receptors whereas alphabeta receptors were characterized by a lower main conductance state (approximately 11 pS). Recording from pyramidal cell somata revealed a similar range of channel conductances, indicative of a mixture of GABA(A) receptors in the extrasynaptic membrane. The lowest conductance state (approximately 11 pS) was the most sensitive to Zn(2+) inhibition in accord with the presence of alphabeta receptors. This receptor type is estimated to account for up to 10% of all extrasynaptic GABA(A) receptors on hippocampal pyramidal neurons.
Figures
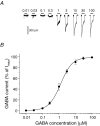
Figure 1. GABA sensitivity of hippocampal pyramidal neurons
A, membrane currents recorded from a single pyramidal neuron voltage clamped at −70 mV. The currents were activated by range of GABA concentrations applied for 4 s (at time shown). The occasional downward deflections represent miniature IPSCs. B, GABA concentration–response curve for peak GABA-activated currents. Responses have been normalized to the response induced by a saturating concentration of GABA. The data were accrued from cultured hippocampal pyramidal neurons after 10–14 days in vitro (DIV). Each data point represents mean ±
s.e.m.
(n = 10). The data are fitted with the Hill equation.
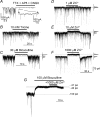
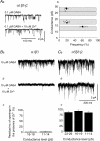
Figure 2. Functional profile of phasic and tonic inhibitory membrane currents from pyramidal neurons
A, spontaneous and miniature synaptic currents recorded from a cultured hippocampal pyramidal neuron held at −70 mV before and after the application of 0.5 μ
m
TTX, 20 μ
md
-amino-5-phosphonopentanoic acid (AP5) and 10 μ
m
6-cyano-7-nitroquinoxaline-2,3-dione (CNQX) to the Krebs solution. A selected portion of the record is shown below at high time resolution. GABA-mediated miniature IPSCs (mIPSCs) and the tonic (baseline) current were recorded in the presence of TTX, AP5 and CNQX, before and after recovery from the application of 10 m
m
tricine (B), 30 μ
m
bicuculline (C), 1 μ
m
Zn2+ (D), 10 μ
m
Zn2+ (E) and 1 m
m
Zn2+ (F). GABAA receptors are almost solely responsible for the tonic current, as 1 m
m
Zn2+ only has a negligible inhibitory effect after GABAA receptors have been completely blocked with 100 μ
m
bicuculline (G). The tonic current before (lower) and after (upper) ligand exposure are shown as dotted lines. The Gaussian curves depict the mean current and standard deviation of the noise neglecting the distortion caused by the mIPSCs (see Methods).
Figure 3. Zn2+ concentration–response curve for the inhibition of the tonic current in pyramidal neurons
The tonic current prior to application of Zn2+ was defined as 100% and used to normalize the level of inhibition. Each data point represents mean ±
s.e.m.
(n = 8). The biphasic curve fit was achieved using the inhibition function (see Methods). This yielded two IC50 values: 1.89 ± 0.3 μ
m
(35 ± 5% of the population) and 223 ± 7 μ
m
(65 ± 6%).
Figure 4. Titration of exogenous GABA concentrations required to reproduce the tonic current in pyramidal neurons
A, application of low GABA concentrations (10, 30, 100, 300 and 1000 n
m
) and their effect on the tonic and phasic currents in the presence of 0.5 μ
m
TTX, 20 μ
md
-amino-5-phosphonopentanoic acid (AP5) and 10 μ
m
6-cyano-7-nitroquinoxaline-2,3-dione (CNQX). B, in the presence of a background 100 n
m
concentration of GABA (continuous lines), the tonic and phasic currents were exposed to 1, 10, 100 and 1000 μ
m
Zn2+ (hatched bars). The dotted lines reveal the shifts in the tonic current.
Figure 5. Two components characterize the Zn2+ inhibition of the tonic current induced by GABA application
Zn2+ inhibition concentration–response curves for the tonic current of cultured pyramidal neurons induced by 100 n
m
GABA (A) or 2 μ
m
GABA (B), in the absence (filled symbols) or presence (open symbols) of 200 n
m
diazepam. The currents are normalized to the control tonic current in the absence of Zn2+. The dotted line in (A) represents the biphasic Zn2+ inhibition curve taken from Fig. 3 for comparison. Each data point represents mean ±
s.e.m.
(n = 8–9).
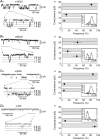
Figure 6. Single-channel conductances associated with recombinant GABAA receptors
The lefthand column (Aa_–_Da) shows GABA-activated single channel currents recorded from outside-out patches taken from HEK (Aa, Ba and Da) or Ltk (Ca) cells expressing α1β3γ2 (Aa; 100 μ
m
GABA), α5β3γ2 (Ba; 100 μ
m
GABA), α4β3δ (Ca; 30 μ
m
GABA) and α1β3 (Da; 10 μ
m
GABA). Selected portions of the single-channel current recordings (grey line) are shown at high time resolution (lower traces) together with the associated zero current level (dotted line) and various current amplitude levels (dashed lines). The righthand column shows the frequencies of the various conductance levels obtained by analysis of the single channel records for α1β3γ2 receptors (Ab), α5β3γ2 (Bb), α4β3δ (Cb) and α1β3 receptors (Db). Data points are means ±
s.e.m.
from n = 4–8 patches. The hatched bars indicate the approximate range of conductance levels that are common to all four receptors. The insets show the frequency distributions for the various conductance levels.
Figure 7. Multiple single GABA channel conductances are present in hippocampal pyramidal neurons
A, single-channel currents activated by applying 10 μ
m
GABA to an outside-out patch taken from a hippocampal pyramidal neuron. Three segments (grey lines) are shown at high time resolution (lower panel) and the relevant conductance levels are shown by dashed lines. B, relationship between the four conductance levels and their relative frequencies are shown. All the data points are mean ±
s.e.m.
from n = 9 patches. Hatched bars indicate the conductance level ranges found in the analyses of the recombinant GABAA receptors taken from Fig. 6 for comparison.
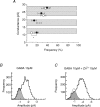
Figure 8. Zn2+ inhibition of the GABA channel low conductance level in pyramidal neurons
A, relationship between the openings of the GABA channel to various conductance levels, following activation by 10 μ
m
GABA and their relative frequency before (•, taken from Fig. 7_B_) and then after the co-application of GABA with 10 μ
m
Zn2+ (○). Data were recorded from nine outside-out patches at −70 mV. The asterisk indicates that only the lowest conductance state was significantly inhibited by Zn2+ (P < 0.05). B and C, GABA single-channel current amplitude histograms compiled following activation of the channels by 10 μ
m
GABA in the absence (B) and presence (C) of 10 μ
m
Zn2+. A single Gaussian (grey filled area) has been fitted to both distributions to highlight the low conductance level (∼0.8 pA; 11–12 pS). The area of this Gaussian decreases from 19% in control (B) to 9% in the presence of Zn2+ (C). The control Gaussian is superimposed on C as a dotted line.
Figure 9. Zn2+ inhibition of GABA channel conductance states for α1β3γ2, α1β3 and α5β3γ2 GABAA receptors expressed in HEK cells
Aa, single GABA channel currents activated by 0.1 μ
m
GABA for α1β3γ2 receptors in the absence or presence of 10 μ
m
Zn2+. Ab, relationship between the openings of the α1β3γ2 GABA channel to various conductance levels and their relative frequency before (•) and after co-application of 0.1 μ
m
GABA and 10 μ
m
Zn2+ (○;n = 7 patches). The concentration of GABA was titrated to 0.1 μ
m
to promote the opening frequency of GABA channels to the lowest conductance state. Ba and b, single-channel openings by α1β3 GABAA receptors induced by 10 μ
m
GABA in the absence (a) and presence (b) of 10 μ
m
Zn2+. Bc, bargraph of the number of residual α1β3 channel openings to the medium and low conductance levels in the presence of Zn2+ (n = 3). Ca, single-channel openings for α5β3γ2 GABAA receptors induced by 10 μ
m
GABA in the absence (a) and presence (b) of 10 μ
m
Zn2+. Cc, bargraph of GABA channel openings for α5β3γ2 receptors in the presence of Zn2+ (n = 4). All currents are recorded from outside-out patches at −70 mV.
Similar articles
- Tonically activated GABAA receptors in hippocampal neurons are high-affinity, low-conductance sensors for extracellular GABA.
Yeung JY, Canning KJ, Zhu G, Pennefather P, MacDonald JF, Orser BA. Yeung JY, et al. Mol Pharmacol. 2003 Jan;63(1):2-8. doi: 10.1124/mol.63.1.2. Mol Pharmacol. 2003. PMID: 12488530 - Context-Dependent Modulation of GABAAR-Mediated Tonic Currents.
Patel B, Bright DP, Mortensen M, Frølund B, Smart TG. Patel B, et al. J Neurosci. 2016 Jan 13;36(2):607-21. doi: 10.1523/JNEUROSCI.2047-15.2016. J Neurosci. 2016. PMID: 26758848 Free PMC article. - Graded response to GABA by native extrasynaptic GABA receptors.
Lindquist CE, Birnir B. Lindquist CE, et al. J Neurochem. 2006 Jun;97(5):1349-56. doi: 10.1111/j.1471-4159.2006.03811.x. Epub 2006 Mar 29. J Neurochem. 2006. PMID: 16573642 - Discovering the Intriguing Properties of Extrasynaptic γ-Aminobutyric Acid Type A Receptors.
Orser BA. Orser BA. Anesthesiology. 2024 Jun 1;140(6):1192-1200. doi: 10.1097/ALN.0000000000004949. Anesthesiology. 2024. PMID: 38624275 Review. - Regulation of excitability by extrasynaptic GABA(A) receptors.
Walker MC, Semyanov A. Walker MC, et al. Results Probl Cell Differ. 2008;44:29-48. doi: 10.1007/400_2007_030. Results Probl Cell Differ. 2008. PMID: 17671772 Review.
Cited by
- Preventing Phosphorylation of the GABA A R β3 Subunit Compromises the Behavioral Effects of Neuroactive Steroids.
Vien TN, Ackley MA, Doherty JJ, Moss SJ, Davies PA. Vien TN, et al. Front Mol Neurosci. 2022 Mar 31;15:817996. doi: 10.3389/fnmol.2022.817996. eCollection 2022. Front Mol Neurosci. 2022. PMID: 35431797 Free PMC article. - Differential tonic GABA conductances in striatal medium spiny neurons.
Ade KK, Janssen MJ, Ortinski PI, Vicini S. Ade KK, et al. J Neurosci. 2008 Jan 30;28(5):1185-97. doi: 10.1523/JNEUROSCI.3908-07.2008. J Neurosci. 2008. PMID: 18234896 Free PMC article. - Identification of binding sites contributing to volatile anesthetic effects on GABA type A receptors.
Woll KA, Zhou X, Bhanu NV, Garcia BA, Covarrubias M, Miller KW, Eckenhoff RG. Woll KA, et al. FASEB J. 2018 Aug;32(8):4172-4189. doi: 10.1096/fj.201701347R. Epub 2018 Mar 5. FASEB J. 2018. PMID: 29505303 Free PMC article. - Synaptic-type α1β2γ2L GABAA receptors produce large persistent currents in the presence of ambient GABA and anesthetic drugs.
Li P, Akk G. Li P, et al. Mol Pharmacol. 2015 May;87(5):776-81. doi: 10.1124/mol.114.096453. Epub 2015 Feb 9. Mol Pharmacol. 2015. PMID: 25667223 Free PMC article. - The α5-Containing GABAA Receptors-a Brief Summary.
Mohamad FH, Has ATC. Mohamad FH, et al. J Mol Neurosci. 2019 Feb;67(2):343-351. doi: 10.1007/s12031-018-1246-4. Epub 2019 Jan 3. J Mol Neurosci. 2019. PMID: 30607899 Review.
References
- Bai D, Zhu G, Pennefather P, Jackson MF, MacDonald JF, Orser BA. Distinct functional and pharmacological properties of tonic and quantal inhibitory postsynaptic currents mediated by γ-aminobutyric acidA receptors in hippocampal neurons. Mol Pharmacol. 2001;59:814–824. - PubMed
- Bencsits E, Ebert V, Tretter V, Sieghart W. A significant part of native γ-aminobutyric acidA receptors containing α4 subunits do not contain γ or δ subunits. J Biol Chem. 1999;274:19613–19616. - PubMed
Publication types
MeSH terms
Substances
LinkOut - more resources
Full Text Sources
Miscellaneous
