Resolution of a chronic viral infection after interleukin-10 receptor blockade - PubMed (original) (raw)
Resolution of a chronic viral infection after interleukin-10 receptor blockade
Mette Ejrnaes et al. J Exp Med. 2006.
Abstract
A defining characteristic of persistent viral infections is the loss and functional inactivation of antiviral effector T cells, which prevents viral clearance. Interleukin-10 (IL-10) suppresses cellular immune responses by modulating the function of T cells and antigen-presenting cells. In this paper, we report that IL-10 production is drastically increased in mice persistently infected with lymphocytic choriomeningitis virus. In vivo blockade of the IL-10 receptor (IL-10R) with a neutralizing antibody resulted in rapid resolution of the persistent infection. IL-10 secretion was diminished and interferon gamma production by antiviral CD8+ T cells was enhanced. In persistently infected mice, CD8alpha+ dendritic cell (DC) numbers declined early after infection, whereas CD8alpha- DC numbers were not affected. CD8alpha- DCs supported IL-10 production and subsequent dampening of antiviral T cell responses. Therapeutic IL-10R blockade broke the cycle of IL-10-mediated immune suppression, preventing IL-10 priming by CD8alpha- DCs and enhancing antiviral responses and thereby resolving infection without causing immunopathology.
Figures
Figure 1.
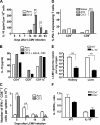
Time course of T cell cytokine production after infection with LCMV clone 13: the role of IL-10 in promoting viral persistence. (A) Spleen cells were isolated from BALB/c mice on days 0, 5, 7, 14, 20, 40, and 94 after infection with 105 PFU LCMV Armstrong or 2 × 10⁶ PFU LCMV clone 13 and cultured for 48 h. The concentration of IL-10 present in the culture supernatants was measured by ELISA. Data are plotted as IL-10 (pg/ml) produced per 106 cells and are means of three mice per time point. The experiment is representative of three similar experiments. (B) To reveal the origin of IL-10–producing cell subsets, BALB/c splenocytes were isolated and infected in vitro for 48 h with LCMV Armstrong or LCMV clone 13 without or with anti–IL-10R antibody treatment (multiplicity of infection = 3). Next, CD4+, CD8+, and CD11c+ cells were enriched using MACS beads, and the supernatant of the purified populations was analyzed for IL-10 production by ELISA. The graph indicates the levels of IL-10 (pg/ml) in the supernatant of CD4+, CD8+, and CD11c+ cells. Data are representative of one experiment with five mice per group. (C) Sensitive direct in vivo intracellular cytokine assay was performed to detect in vivo cytokine expression in LCMV-specific T cells, as described by Liu et al. (reference 61). In brief, mice were injected i.v. with 0.5 mg BFA on days 5 and 7 after infection with 105 PFU LCMV Armstrong or 2 × 10⁶ PFU LCMV clone 13. Spleens were harvested 6 h after BFA injection, and direct in vivo intracellular cytokine detection was performed after staining with fluorescent antibodies to CD4, CD8, IFN-γ, and TNF-α. Mean values per spleen of three to five individual mice are shown. The experiment is representative of two similar experiments. (D) PD-1 expression was detected on CD4+ and CD8+ T cells from naive or day 7 LCMV Armstrong– or LCMV clone 13–infected mice by labeling splenocytes with fluorescent antibodies to CD4, CD8, and PD-1. Percentages of PD-1–expressing T cells are shown. Data show one representative mouse per group (three mice total per group). (E) IL-10−/− and wild-type mice were infected with 2 × 10⁶ PFU LCMV clone 13, and viral titers were detected in kidney and liver from three mice per group by RT-PCR 3 wk after infection. Data are shown as mean LCMV genome copies per mg organ ± SEM. (F) Cytokine expression was monitored in wild-type and IL-10−/− mice 7 d after LCMV clone 13 infection by intracellular cytokine staining. Splenocytes were stimulated with BFA and GP33-41 or GP61-80 peptide for 6 h. Intracellular cytokine detection was performed by staining with fluorescent antibodies to CD4, CD8, IFN-γ, and TNF-α. The IL-10/IFN-γ ratio of CD4+ and CD8+ T cells is shown as mean values of three individual mice per group. Statistical analysis was performed using the Student's t test. *, P < 0.01; **, P < 0.001; and ***, P < 0.0001.
Figure 2.
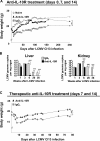
Clearance of virus in LCMV clone 13–infected mice treated with anti–IL-10R antibody. 6-wk-old BALB/c mice were infected with 2 × 10⁶ PFU LCMV clone 13 and treated i.p. with 250 μg of a neutralizing anti–IL-10R antibody or an IgG1 isotype control antibody on days 0, 7, and 14 (A and B) or days 7 and 14 after infection (C). (A) Disease severity was evaluated by measuring the body weight of naive mice and LCMV clone 13–infected mice injected with anti–IL-10R antibody or IgG1 isotype control antibody. Mice were monitored daily and weighed every third day. Data show mean body weight (in grams) ± SEM per group (n = 5) over time and are representative of five experiments (25 mice total per group). (B) Quantitative real time PCR for LCMV genome copies was performed on the cDNA obtained by reverse transcription in quick-frozen organs from LCMV clone 13–infected mice treated with IgG1 isotype control or anti–IL-10R antibody. Liver (left) and kidney (right) were harvested 1, 3, 6, 26, and 36 wk after infection, and viral titers were measured by quantitative RT-PCR. Quantitative analysis was performed using the GraphPad Prism linear regression method. Histogram bars represent means values ± SD for four to six mice per group. The experiment is representative of five similar experiments. (C) Disease severity was evaluated by measuring body weight as described in A in mice treated therapeutically with anti–IL-10R antibody or IgG1 isotype control antibody on days 7 and 14 after LCMV clone 13 infection. Data show mean body weight (in grams) ± SEM per group (n = 5) over time and are representative of two experiments (25 mice total per group). Statistical analysis was performed using the Student's t test. **, P < 0.001; and ***, P < 0.0001.
Figure 3.
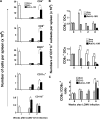
Anti–IL-10R antibody treatment in LCMV clone 13–infected mice increases total cell numbers, decreases IL-10 production, induces a functional antiviral memory T cell pool, and reduces the percentage of PD-1–expressing T cells. (A) 6-wk-old BALB/c mice were infected with 2 × 10⁶ PFU LCMV clone 13 and treated with an IgG1 isotype control antibody or i.p. with 250 μg of a neutralizing anti–IL-10R antibody on days 0, 7, and 14 (left) or with a therapeutic regimen on days 7 and 14 after LCMV clone 13 infection (right). On days 20 and 150 after LCMV infection, spleen cells were isolated and counted. Histogram bars represent mean values ± SD for three mice per group. The experiment is representative of three similar experiments. (B) Splenocytes from naive mice, LCMV clone 13–infected mice treated with IgG1, or anti–IL-10R antibody on days 0, 7, and 14 were isolated 3 wk after infection and cultured for 48 h. The amount of IL-10 present in the culture supernatant was measured by ELISA. Data are plotted as IL-10 (pg/ml) produced per 106 cells and are means of three mice per time point. Results are representative of three identical experiments. (C) Splenocytes from LCMV clone 13–infected BALB/c mice treated with IgG1 or anti–IL-10R antibody on days 0, 7, and 14 (left) or day 7 and 14 (right) were isolated at day 20 (early memory) and 150 (late memory) after infection. Cells were stimulated in the presence of NP118-126 peptide and BFA for 5 h. Intracellular cytokine staining was performed using fluorescent antibodies to CD8 and IFN-γ. The numbers of IFN-γ+CD8+ T cells per spleen are shown. Histogram bars represent mean values ± SD for three mice per group. The experiment is representative of three similar experiments. (D) BALB/c mice were treated with anti–IL-10R antibody or IgG1 isotype control antibody on days 7 and 14 after LCMV clone 13 infection. 90 d after infection, percentages of PD-1–expressing splenic CD4+ and CD8+ T cells were analyzed by gating on CD4+ (left) and CD8+ T cells (right) and staining for PD-1. Numbers in dot plots represent percentages of CD4+ and CD8+ T cells expressing PD-1. Data show one representative mouse per group (four mice total per group). Statistical analysis was performed using the Student's t test. *, P < 0.01; **, P < 0.001; and ***, P < 0.0001.
Figure 4.
Anti–IL-10R treatment restores cell numbers in LCMV clone 13–infected mice and resets the CD8α− versus CD8α+ DC ratio to levels observed in LCMV Armstrong–infected mice. (A) The effect of 250 μg anti–IL-10R antibody (i.p.) or IgG1 isotype control antibody treatment on different splenic cell subsets was monitored quantitatively. Spleens of mice infected 3 or 21 wk earlier with LCMV clone 13 were harvested, and cell suspensions were stained with fluorescent antibodies to CD4, CD8, B220, CD11c, and CD11b. Age-matched naive mice were included as controls. Numbers of cells were quantified by relating the percentage to total numbers of spleen cells. Mean values for three to five individual mice are shown. Results are representative of three similar experiments. (B and C) The total numbers of CD11c+CD8α− (B, top) or CD11c+CD8α+ splenic DC subsets (B, bottom) and the CD8α− to CD8α+ DC ratios (C) were determined 0, 1, 2, and 6 wk after LCMV Armstrong or LCMV clone 13 infection. In addition, absolute splenic DC subsets (B) and the CD8α− to CD8α+ DC ratio (C) were calculated from mice therapeutically treated with anti–IL10R on days 7 and 14 after LCMV clone 13 infection; the latter was examined at 6 wk after infection only. Cell suspensions were prepared by digestion with collagenase D. Cells were then stained with fluorescent antibodies to CD11c, CD3, and CD8α. The percentage of CD8α− and CD8α+ within the CD11c+CD3− subset was determined by flow cytometry, and total numbers per spleen were quantified by relating the percentage of these cells to total numbers of CD11c+CD3− spleen cells. Histogram bars represent mean values ± SD for three mice per group. The experiment is representative of three similar experiments. Statistical analysis was performed using the Student's t test. *, P < 0.01; and **, P < 0.001.
Figure 5.
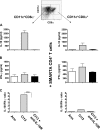
Anti–IL-10R treatment abolishes IL-10 production by CD8α− and CD8α+ DC subsets, restoring a Tc1/Th1-favorable environment. Spleens were isolated and pooled from mice 7 d after infection with LCMV Armstrong or LCMV clone 13 or from LCMV clone 13–infected mice treated with anti–IL-10R antibody at the time of infection (8–10 mice per group). Splenocytes were depleted of CD3+ cells and enriched based on expression of CD11c using MACS microbeads. Next, the purified CD11c+ population was labeled with fluorescent antibodies to CD11c and CD8α and sorted into CD11c+CD8α− (left) or CD11c+CD8α+ DCs (right) by flow cytometry. The sorted DCs were irradiated (2,900 rad), and 1.5 × 10⁵ DCs from each subset were cultured in U-bottom 96-well plates in the presence of 6 × 10⁵ GP61-80-specific CD4+ T cells isolated from naive TCR transgenic SMARTA mice (reference 52). After 5 d, the concentration of IL-10 (A) and IFN-γ (B) present in the culture supernatants was measured by ELISA (pg/ml). No detectable IL-10 or IFN-γ was secreted by irradiated DCs alone (not depicted). Data was obtained from two independent experiments. Histogram bars represent mean values from one representative experiment ± SD from triplicate wells. (C) The results are depicted as the IL-10 to IFN-γ ratio to reflect the overall trend toward IL-10 production by the stimulated CD4+ T cells. Statistical analysis was performed using the Student's t test. ***, P < 0.0001.
Comment in
- Interleukin-10 and viral clearance: translation to viral hepatitis.
Thimme R, Opitz OG. Thimme R, et al. Gastroenterology. 2007 Jun;132(7):2611-3. doi: 10.1053/j.gastro.2007.04.049. Gastroenterology. 2007. PMID: 17570238 No abstract available.
Similar articles
- Reversal of chronic to resolved infection by IL-10 blockade is LCMV strain dependent.
Richter K, Perriard G, Oxenius A. Richter K, et al. Eur J Immunol. 2013 Mar;43(3):649-54. doi: 10.1002/eji.201242887. Epub 2013 Jan 25. Eur J Immunol. 2013. PMID: 23348876 - Interleukin-10 plays an early role in generating virus-specific T cell anergy.
Maris CH, Chappell CP, Jacob J. Maris CH, et al. BMC Immunol. 2007 Jun 14;8:8. doi: 10.1186/1471-2172-8-8. BMC Immunol. 2007. PMID: 17570849 Free PMC article. - Interleukin-27R Signaling Mediates Early Viral Containment and Impacts Innate and Adaptive Immunity after Chronic Lymphocytic Choriomeningitis Virus Infection.
Harker JA, Wong KA, Dallari S, Bao P, Dolgoter A, Jo Y, Wehrens EJ, Macal M, Zuniga EI. Harker JA, et al. J Virol. 2018 May 29;92(12):e02196-17. doi: 10.1128/JVI.02196-17. Print 2018 Jun 15. J Virol. 2018. PMID: 29593047 Free PMC article. - Cure of chronic viral infection by neutralizing antibody treatment.
Ejrnaes M, von Herrath MG. Ejrnaes M, et al. Autoimmun Rev. 2007 Apr;6(5):267-71. doi: 10.1016/j.autrev.2006.09.002. Epub 2006 Oct 12. Autoimmun Rev. 2007. PMID: 17412296 Review. - IL-10: achieving balance during persistent viral infection.
Ng CT, Oldstone MB. Ng CT, et al. Curr Top Microbiol Immunol. 2014;380:129-44. doi: 10.1007/978-3-662-43492-5_6. Curr Top Microbiol Immunol. 2014. PMID: 25004816 Review.
Cited by
- Natural history of chronic hepatitis B virus infection.
Busch K, Thimme R. Busch K, et al. Med Microbiol Immunol. 2015 Feb;204(1):5-10. doi: 10.1007/s00430-014-0369-7. Epub 2014 Dec 25. Med Microbiol Immunol. 2015. PMID: 25540037 Review. - Design and analysis of rhesus cytomegalovirus IL-10 mutants as a model for novel vaccines against human cytomegalovirus.
Logsdon NJ, Eberhardt MK, Allen CE, Barry PA, Walter MR. Logsdon NJ, et al. PLoS One. 2011;6(11):e28127. doi: 10.1371/journal.pone.0028127. Epub 2011 Nov 21. PLoS One. 2011. PMID: 22132227 Free PMC article. - IRF-5-Mediated Inflammation Limits CD8+ T Cell Expansion by Inducing HIF-1α and Impairing Dendritic Cell Functions during Leishmania Infection.
Hammami A, Charpentier T, Smans M, Stäger S. Hammami A, et al. PLoS Pathog. 2015 Jun 5;11(6):e1004938. doi: 10.1371/journal.ppat.1004938. eCollection 2015 Jun. PLoS Pathog. 2015. PMID: 26046638 Free PMC article. - Role of interleukin 10 transcriptional regulation in inflammation and autoimmune disease.
Iyer SS, Cheng G. Iyer SS, et al. Crit Rev Immunol. 2012;32(1):23-63. doi: 10.1615/critrevimmunol.v32.i1.30. Crit Rev Immunol. 2012. PMID: 22428854 Free PMC article. Review. - Prostaglandin E2 and programmed cell death 1 signaling coordinately impair CTL function and survival during chronic viral infection.
Chen JH, Perry CJ, Tsui YC, Staron MM, Parish IA, Dominguez CX, Rosenberg DW, Kaech SM. Chen JH, et al. Nat Med. 2015 Apr;21(4):327-34. doi: 10.1038/nm.3831. Epub 2015 Mar 23. Nat Med. 2015. PMID: 25799228 Free PMC article.
References
- Moore, K.W., A. O'Garra, R. de Waal Malefyt, P. Vieira, and T.R. Mosmann. 1993. Interleukin-10. Annu. Rev. Immunol. 11:165–190. - PubMed
- Pestka, S., C.D. Krause, D. Sarkar, M.R. Walter, Y. Shi, and P.B. Fisher. 2004. Interleukin-10 and related cytokines and receptors. Annu. Rev. Immunol. 22:929–979. - PubMed
- Vicari, A.P., C. Chiodoni, C. Vaure, S. Ait-Yahia, C. Dercamp, F. Matsos, O. Reynard, C. Taverne, P. Merle, M.P. Colombo, et al. 2002. Reversal of tumor-induced dendritic cell paralysis by CpG immunostimulatory oligonucleotide and anti–interleukin-10 receptor antibody. J. Exp. Med. 196:541–549. - PMC - PubMed
- Vicari, A.P., and G. Trinchieri. 2004. Interleukin-10 in viral diseases and cancer: exiting the labyrinth? Immunol. Rev. 202:223–236. - PubMed
- Orange, J.S., M.S. Fassett, L.A. Koopman, J.E. Boyson, and J.L. Strominger. 2002. Viral evasion of natural killer cells. Nat. Immunol. 3:1006–1012. - PubMed
Publication types
MeSH terms
Substances
LinkOut - more resources
Full Text Sources
Other Literature Sources
Molecular Biology Databases
Research Materials


