Coregulation of vascular tube stabilization by endothelial cell TIMP-2 and pericyte TIMP-3 - PubMed (original) (raw)
Coregulation of vascular tube stabilization by endothelial cell TIMP-2 and pericyte TIMP-3
W Brian Saunders et al. J Cell Biol. 2006.
Abstract
The endothelial cell (EC)-derived tissue inhibitor of metalloproteinase-2 (TIMP-2) and pericyte-derived TIMP-3 are shown to coregulate human capillary tube stabilization following EC-pericyte interactions through a combined ability to block EC tube morphogenesis and regression in three-dimensional collagen matrices. EC-pericyte interactions strongly induce TIMP-3 expression by pericytes, whereas ECs produce TIMP-2 in EC-pericyte cocultures. Using small interfering RNA technology, the suppression of EC TIMP-2 and pericyte TIMP-3 expression leads to capillary tube regression in these cocultures in a matrix metalloproteinase-1 (MMP-1)-, MMP-10-, and ADAM-15 (a disintegrin and metalloproteinase-15)-dependent manner. Furthermore, we show that EC tube morphogenesis (lumen formation and invasion) is primarily controlled by the TIMP-2 and -3 target membrane type (MT) 1 MMP. Additional targets of these inhibitors include MT2-MMP and ADAM-15, which also regulate EC invasion. Mutagenesis experiments reveal that TIMP-3 requires its proteinase inhibitory function to induce tube stabilization. Overall, these data reveal a novel role for both TIMP-2 and -3 in the pericyte-induced stabilization of newly formed vascular networks that are predisposed to undergo regression and reveal specific molecular targets of the inhibitors regulating these events.
Figures
Figure 1.
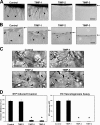
EC invasion and tubular morphogenesis in 3D collagen matrices are inhibited by TIMP-2 and -3. (A) ECs were seeded onto collagen matrices and stimulated to invade for 48 h in response to 1 μM S1P in the absence (control) or presence of 5 μg/ml TIMP-1, -2, or -3. Arrows indicate the EC monolayer; arrowheads point to the invading EC sprouts. Bar, 100 μm. (B) Plastic sections of these cultures are shown to illustrate the presence (control; TIMP-1) or absence (TIMP-2 and -3) of EC lumenal structures (arrowheads). Arrows indicate the EC monolayer; arrowheads point to EC lumens. Bar, 40 μm. (C) ECs were suspended within collagen matrices and allowed to undergo morphogenesis and tube network formation for 48 h in the absence (control) or presence of 5 μg/ml TIMP-1, -2, or -3 using time-lapse microscopy. Arrows point to multicellular EC tube networks; arrowheads indicate fine processes. Bar, 50 μm. (D) Graphs show the mean invasion distance in micrometers (left) or the total number of ECs forming lumens (right) ± SD (error bars) using time-lapse images at 48 h. *, P < 0.01 for TIMP-2– or -3–treated ECs compared with controls. HPF, high-powered field.
Figure 2.
MT metalloproteinases are required for the remodeling of vascular networks in vivo during mouse vascular development, and TIMP-3 is expressed by perivascular mesenchyme. (A) E7.5 cultures were established as described previously (Bohnsack et al., 2004) and, in addition, were incubated in the presence of 5 μg/ml TIMP-1 or -3. Cultures were photographed live (left two panels) or were immunostained (right) after 48 h for VE-cadherin expression. Magnified live images from the boxed areas are shown in the adjacent panels for each treatment condition. (B) RT-PCR analysis was performed on extraembryonic (X) and embryonic tissue (E) at the days indicated using primers specific for TIMP-1, -3, and control. (C) Tissue sections at the indicated times were stained with antibodies directed to TIMP-3, VE-cadherin, and angiopoietin-1 (Ang-1). Bars, 100 μm.
Figure 3.
Coculture of ECs with BRPs results in a marked induction of pericyte-derived TIMP-3 and a decreased production of EC-derived MMP-1. (A) ECs were suspended in 3D collagen matrices and cultured alone or in the presence of varying amounts of BRPs relative to EC number for 48 h before the collection of conditioned media or preparation of cell extracts. (B) Varying concentrations of ECs (relative to 100% EC culture) were cocultured with 3 × 10⁵ cells/ml BRPs or were cultured alone. Western blots for the indicated antigens were performed. (C) ECs treated with TIMP-2 siRNA were cocultured with BRPs treated with luciferase control siRNA (Luc) and vice versa as shown. PC, pericyte. (D) ECs transfected with TIMP-3 siRNA were cocultured with BRPs transfected with Luc siRNA and vice versa as shown. (C and D) Western blots are shown to determine the indicated TIMP expression after treatment. (E) ECs were cultured alone or in the presence of 30% BRPs (relative to 100% ECs), CASMCs, or normal human dermal fibroblasts (NHDFs) in the presence of 1 μg/ml plasmin for 48 h. Unstained cultures were photographed to assess the extent of regression and gel contraction. Bars, 500 μm.
Figure 4.
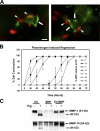
Pericytes markedly block EC tube regression via the inhibition of MMP-1 and -10. (A) EC or BRP stable cell lines expressing GFP or mRFP, respectively, were cocultured with 30% BRPs relative to ECs for 72 h before fluorescence photography. Pericytes (arrowheads) are shown associating with EC-lined tubes (arrows). Bar, 50 μm. (B) ECs were suspended in 3D collagen matrices in the presence of an increasing concentration of BRPs (shown as the percentage relative to ECs). Cultures were supplied with standard media containing 2 μg/ml Plg. Cultures were monitored every 4 h for EC tubular network collapse and collagen gel contraction. Data are reported as the mean percent collagen gel contraction ± SD (error bars) at the indicated times (n = 8). (C) At 72 h, conditioned media were collected and analyzed for MMP-1 and -10 expression and activation via Western blotting. Arrows indicate proenzymes; arrowheads point to activated enzymes.
Figure 5.
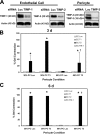
EC-derived TIMP-2 and BRP-derived TIMP-3 are required for EC–pericyte interactions to stabilize EC tube networks. ECs were transfected with siRNAs targeting TIMP-1, TIMP-2, PAI-1, or luciferase control (Luc), and BRPs were transfected in a similar manner with siRNAs targeting TIMP-3 or luciferase control. (A) Western blot analysis of EC-conditioned media and BRP cell lysates indicates the effectiveness of siRNA treatment on the expression of the indicated TIMPs as well as actin controls. (B and C) ECs were suspended in collagen matrices in the presence of 30 or 50% BRPs (relative to ECs) in the indicated combinations. EC tube network regression was induced with 1 μg/ml of activated human plasmin and was quantitated at 3 or 6 d (reported as the mean percentage of gel contraction ± SD [error bars]). *, P < 0.01 compared with luciferase control; †, P < 0.01 for EC TIMP-2 siRNA–treated ECs compared with other samples with 50% BRPs. PC, pericyte.
Figure 6.
MT1-MMP is a TIMP-2 and -3 target required for EC tubular network formation in 3D collagen matrices. ECs were treated with the indicated siRNAs and suspended in 3D collagen matrices for 48 h before fixation for photography or quantitation. (A) Representative fields of ECs treated with MT1-MMP, MT3-MMP, or luciferase control siRNAs. Bar, 100 μm. (B) ECs transfected with the indicated siRNAs were cultured for 24 h before the preparation of lysates for Western blot analysis of the indicated proteinases or actin control (arrowhead). (C) ELISA capture assay showing interactions of MT1-MMP with TIMP-2 and -3. (left) HEK293 cells were cotransfected with MT1-MMP–GFP fusion or MT1-MMP alone with TIMP-2, -3, or control plasmids, and lysates were made after 20 h. Lysates were incubated in microwells coated with an anti-GFP mAb and were probed with antibodies to TIMPs to detect binding interactions. (right) ECs were infected overnight with recombinant adenoviruses carrying TIMP-3–GFP or TIMP-3 alone, and lysates were prepared. Lysates were incubated in microwells coated with an anti-GFP mAb and were probed with an MT1-MMP antibody to detect binding interactions. Error bars represent SD.
Figure 7.
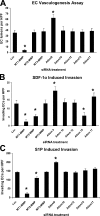
MT1-MMP is required for EC tube network formation as well as invasion and tube formation stimulated by SDF-1α and S1P. (A–C) ECs were treated with the indicated siRNAs and were cultured within collagen matrices (A) or on the surface of collagen matrices containing either SDF-1α (B) or S1P (C) to stimulate invasion. Quantitation of each condition occurred at either 24 (C) or 48 h (A and B). (A) Data are reported as the mean number of EC lumens per high-powered field (HPF; A) or invading ECs per high-powered field (B and C) ± SD (error bars; n = 3). *, P < 0.01 compared with luciferase control.
Figure 8.
MMP-1, MMP-10, and ADAM-15 represent TIMP-2 and -3 targets involved in EC tubular network regression. ECs were transfected with the indicated siRNAs, suspended in 3D collagen matrices, and cultured in the presence of 2 μg/ml Plg to initiate EC tubular network regression. (A) Cultures were monitored every 4 h for tube regression and collagen gel contraction. Data are reported as the mean percent gel contraction ± SD (error bars; n = 8). (B) At 96 h, conditioned media from control cultures (no Plg) or Plg-treated cultures (+Plg) were collected and analyzed by Western blot analysis for MMP-1 and -10 proenzyme (arrow) and activation (arrowhead) levels.
Figure 9.
The proteinase inhibitory activity of TIMP-3 is required for tube stabilization through its ability to inhibit EC invasion, tube formation, and regression. Generation of stable EC cell lines expressing GFP, TIMP-1 (T1), TIMP-3 (T3) wild-type (WT), and mutants is described in Materials and methods. (A) EC-conditioned media or cell lysates were analyzed for TIMP-1 and -3 levels via Western blot analysis. (B) Stable EC cell lines with the indicated expressed constructs were placed on 3D collagen matrices and stimulated to invade with S1P for 48 h, and, after fixation, the invasion response was quantitated (n = 3). (C) The indicated stable EC cell lines were suspended within 3D collagen matrices and allowed to undergo EC tubular network formation for 48 h. After fixation, lumen formation was quantitated. (B and C) *, P < 0.01 compared with GFP control. (D) EC cell lines were suspended as in C and were cultured in the presence of 2 μg/ml Plg. Cultures were monitored every 4 h for EC tube regression and collagen gel contraction. Data are reported as the mean percent gel contraction ± SD (error bars; n = 8). HPF, high-powered field.
Figure 10.
Schematic diagram illustrating the contribution of TIMP-2 and -3 to pericyte-induced vascular tube stabilization. As shown, TIMP-2 is derived from ECs, whereas TIMP-3 is produced by pericytes. Together, they contribute to vascular stabilization by inhibiting a variety of MMPs, ADAMs, and VEGFR-2. The initiation of tube stabilization requires the blockade of both EC tube formation and EC tube regression, which further leads to the cessation of EC activation and the development of EC quiescence. We hypothesize that pericytes are required for ECs to assemble basement membrane matrices, which locally capture and present TIMP-3 to ECs through heparan sulfate proteoglycans such as perlecan.
Similar articles
- Molecular balance of capillary tube formation versus regression in wound repair: role of matrix metalloproteinases and their inhibitors.
Davis GE, Saunders WB. Davis GE, et al. J Investig Dermatol Symp Proc. 2006 Sep;11(1):44-56. doi: 10.1038/sj.jidsymp.5650008. J Investig Dermatol Symp Proc. 2006. PMID: 17069010 Review. - Mechanisms controlling human endothelial lumen formation and tube assembly in three-dimensional extracellular matrices.
Davis GE, Koh W, Stratman AN. Davis GE, et al. Birth Defects Res C Embryo Today. 2007 Dec;81(4):270-85. doi: 10.1002/bdrc.20107. Birth Defects Res C Embryo Today. 2007. PMID: 18228260 Review. - Pericyte recruitment during vasculogenic tube assembly stimulates endothelial basement membrane matrix formation.
Stratman AN, Malotte KM, Mahan RD, Davis MJ, Davis GE. Stratman AN, et al. Blood. 2009 Dec 3;114(24):5091-101. doi: 10.1182/blood-2009-05-222364. Epub 2009 Oct 12. Blood. 2009. PMID: 19822899 Free PMC article. - MMP-1 activation by serine proteases and MMP-10 induces human capillary tubular network collapse and regression in 3D collagen matrices.
Saunders WB, Bayless KJ, Davis GE. Saunders WB, et al. J Cell Sci. 2005 May 15;118(Pt 10):2325-40. doi: 10.1242/jcs.02360. Epub 2005 May 3. J Cell Sci. 2005. PMID: 15870107
Cited by
- Defective pericyte recruitment of villous stromal vessels as the possible etiologic cause of hydropic change in complete hydatidiform mole.
Kim KR, Sung CO, Kwon TJ, Lee J, Robboy SJ. Kim KR, et al. PLoS One. 2015 Apr 7;10(4):e0122266. doi: 10.1371/journal.pone.0122266. eCollection 2015. PLoS One. 2015. PMID: 25849742 Free PMC article. - Angiopreventive efficacy of pure flavonolignans from milk thistle extract against prostate cancer: targeting VEGF-VEGFR signaling.
Deep G, Gangar SC, Rajamanickam S, Raina K, Gu M, Agarwal C, Oberlies NH, Agarwal R. Deep G, et al. PLoS One. 2012;7(4):e34630. doi: 10.1371/journal.pone.0034630. Epub 2012 Apr 13. PLoS One. 2012. PMID: 22514647 Free PMC article. - Fabrication of centimeter-scale and geometrically arbitrary vascular networks using in vitro self-assembly.
Morgan JT, Shirazi J, Comber EM, Eschenburg C, Gleghorn JP. Morgan JT, et al. Biomaterials. 2019 Jan;189:37-47. doi: 10.1016/j.biomaterials.2018.10.021. Epub 2018 Oct 22. Biomaterials. 2019. PMID: 30384127 Free PMC article. - Lymphatics in idiopathic pulmonary fibrosis: new insights into an old disease.
El-Chemaly S, Pacheco-Rodriguez G, Ikeda Y, Malide D, Moss J. El-Chemaly S, et al. Lymphat Res Biol. 2009 Dec;7(4):197-203. doi: 10.1089/lrb.2009.0014. Lymphat Res Biol. 2009. PMID: 20143918 Free PMC article. Review. - Glycosaminoglycan-based hydrogels to modulate heterocellular communication in in vitro angiogenesis models.
Chwalek K, Tsurkan MV, Freudenberg U, Werner C. Chwalek K, et al. Sci Rep. 2014 Mar 19;4:4414. doi: 10.1038/srep04414. Sci Rep. 2014. PMID: 24643064 Free PMC article.
References
- Anand-Apte, B., M.S. Pepper, E. Voest, R. Montesano, B. Olsen, G. Murphy, S.S. Apte, and B. Zetter. 1997. Inhibition of angiogenesis by tissue inhibitor of metalloproteinase-3. Invest. Ophthalmol. Vis. Sci. 38:817–823. - PubMed
- Baker, A.H., D.R. Edwards, and G. Murphy. 2002. Metalloproteinase inhibitors: biological actions and therapeutic opportunities. J. Cell Sci. 115:3719–3727. - PubMed
- Bayless, K.J., and G.E. Davis. 2003. Sphingosine-1-phosphate markedly induces matrix metalloproteinase and integrin-dependent human endothelial cell invasion and lumen formation in three-dimensional collagen and fibrin matrices. Biochem. Biophys. Res. Commun. 312:903–913. - PubMed
- Bell, S.E., A. Mavila, R. Salazar, K.J. Bayless, S. Kanagala, S.A. Maxwell, and G.E. Davis. 2001. Differential gene expression during capillary morphogenesis in 3D collagen matrices: regulated expression of genes involved in basement membrane matrix assembly, cell cycle progression, cellular differentiation and G-protein signaling. J. Cell Sci. 114:2755–2773. - PubMed
Publication types
MeSH terms
Substances
LinkOut - more resources
Full Text Sources
Other Literature Sources
Molecular Biology Databases
Research Materials
Miscellaneous
