Interleukin-1beta-induced insulin resistance in adipocytes through down-regulation of insulin receptor substrate-1 expression - PubMed (original) (raw)
Interleukin-1beta-induced insulin resistance in adipocytes through down-regulation of insulin receptor substrate-1 expression
Jennifer Jager et al. Endocrinology. 2007 Jan.
Abstract
Inflammation is associated with obesity and insulin resistance. Proinflammatory cytokines produced by adipose tissue in obesity could alter insulin signaling and action. Recent studies have shown a relationship between IL-1beta level and metabolic syndrome or type 2 diabetes. However, the ability of IL-1beta to alter insulin signaling and action remains to be explored. We demonstrated that IL-1beta slightly increased Glut 1 translocation and basal glucose uptake in 3T3-L1 adipocytes. Importantly, we found that prolonged IL-1beta treatment reduced the insulin-induced glucose uptake, whereas an acute treatment had no effect. Chronic treatment with IL-1beta slightly decreased the expression of Glut 4 and markedly inhibited its translocation to the plasma membrane in response to insulin. This inhibitory effect was due to a decrease in the amount of insulin receptor substrate (IRS)-1 but not IRS-2 expression in both 3T3-L1 and human adipocytes. The decrease in IRS-1 amount resulted in a reduction in its tyrosine phosphorylation and the alteration of insulin-induced protein kinase B activation and AS160 phosphorylation. Pharmacological inhibition of ERK totally inhibited IL-1beta-induced down-regulation of IRS-1 mRNA. Moreover, IRS-1 protein expression and insulin-induced protein kinase B activation, AS160 phosphorylation, and Glut 4 translocation were partially recovered after treatment with the ERK inhibitor. These results demonstrate that IL-1beta reduces IRS-1 expression at a transcriptional level through a mechanism that is ERK dependent and at a posttranscriptional level independently of ERK activation. By targeting IRS-1, IL-1beta is capable of impairing insulin signaling and action, and could thus participate in concert with other cytokines, in the development of insulin resistance in adipocytes.
Figures
Figure 1
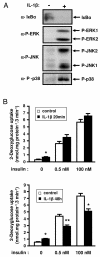
Effect of short or long-term IL-1β treatment on insulin-induced glucose transport in 3T3-L1 adipocytes. A, 3T3-L1 adipocytes were treated with IL-1β for 20 min or left untreated and proteins from cell lysates were prepared as described in “Material and Methods”. IkBα and the phosphorylated forms of ERK, JNK and p38MAPK were detected using specific antibodies. Typical autoradiographs representative of three independent experiments are shown. B, 3T3-L1 adipocytes were treated without (empty bars) or with (black bars) IL-1β (20 ng/ml) for 20 min (upper panel) or 48 h (lower panel) and then cells were incubated without or with insulin (0.5 or 100 nM) for 20 min at 37°C. Uptake of [2-3H]deoxyglucose was measured during a 3-min period as described under “Materials and Methods”. Means ± SEM of five independent experiments are shown. *, IL-1β effect significant with p < 0.01. **, IL-1β effect significant with p < 0.05.
Figure 2
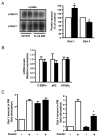
Effect of IL-1β treatment on Glut 4 and Glut 1 expression and insulin-induced Glut 4 and Glut 1 translocation to the plasma membrane in 3T3-L1 adipocytes. A, 3T3-L1 adipocytes were incubated without (empty bars) or with (black bars) IL-1β (20 ng/ml) for 48 h. A, Glut 4 and Glut 1 were detected in cell lysates by immunoblotting with anti-Glut4 or anti-Glut 1 antibodies (α-Glut 4, α-Glut 1). Glut 4 and Glut 1 amounts were quantified by densitometry scanning analysis. Data are expressed as percentage of Glut 4 and Glut 1 amounts in untreated cells and presented as the means ± SEM of four independent experiments. (* p < 0.01). B, total RNAs from cells treated as described in A were extracted and the amount of C/EBPα, aP2 and PPARγ mRNA were quantified by real-time quantitative PCR. mRNA expression was normalized using 36B4 RNA levels and expressed in arbitrary units, with the control cells taken as 1. Results are expressed as the means ± SEM of three independent experiments. C, Plasma membrane sheets were prepared from 3T3-L1 adipocytes incubated without (empty bars) or with IL-1β (20 ng/ml) (black bars) for 48 h and then without or with insulin (100 nM) for 20 min. Glut 1 (Left) and Glut 4 (Right) were detected in plasma membrane (PM) by immunofluorescence using goat anti-Glut 1 or anti-Glut 4 antibodies followed by incubation with FITC-coupled anti-goat antibodies. Quantification of fluorescence level was performed with MetaMorph software as described in “Materials and Methods”. Results are expressed as fold stimulation of control cells and presented as the means ± SEM of three independent experiments. *, IL-1β effect significant with p < 0.05.
Figure 3
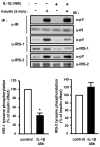
Differential effects of IL-1β treatment on insulin-stimulated tyrosine phosphorylation of the insulin receptor, IRS-1 and IRS-2. 3T3-L1 adipocytes were treated without or with IL-1β (20 ng/ml) for 48 h and then without or with insulin for 5 min. Proteins were immunoprecipitated (IP) using anti-insulin receptor (α-IR) antibodies, anti-IRS1 (α-IRS1) or anti-IRS2 (α-IRS2) antibodies and immunoprecipitated proteins were resolved by SDS-PAGE and blotted (IB) using anti-phosphotyrosine (α-pY) antibodies. The membrane was then stripped and probed using α-IR, α-IRS1, or α-IRS2 antibodies. Typical autoradiographs representative of four to five experiments are shown. The absolute Tyr-phosphorylation of IRS-1 or IRS-2 was quantified by densitometry scanning analysis. Results are expressed as percentage of insulin effect in control cells and presented as the means ± SEM of five independent experiments. *, IL-1β effect significant with p < 0.01.
Figure 4
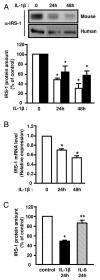
IL-1β treatment decreases IRS-1 expression in 3T3-L1 adipocytes and in human adipocytes. Mouse 3T3-L1 adipocytes (empty bars) or human preadipocytes-derived adipocytes (black bars) were incubated without or with IL-1β (20 ng/ml) for 24 or 48 hours. Proteins from cell lysates were blotted using anti-IRS1 (α-IRS1) antibodies. A, Representative autoradiograph is shown, and IRS-1 amount was quantified by densitometry scanning analysis. Results are expressed as percentage of IRS-1 protein amount in control cells and presented as the means ± SEM of four independent experiments. *, IL-1β effect significant for 3T3-L1 adipocytes or human adipocytes respectively with p < 0.01. B, Total RNAs were extracted and the relative amounts of IRS-1 mRNA were determined by real-time PCR. mRNA expression was normalized using 36B4 RNA levels. Results are expressed in arbitrary units, with the control values taken as 1 and are the means ± SEM of three independent experiments. *, IL-1β effect significant with p < 0.01. C, 3T3-L1 adipocytes were left untreated (empty bar) or incubated with IL-1β (20 ng/ml) (black bar) or IL-6 (20 ng/ml) (hatched bar) for 24 hours and IRS-1 amount was determined as described in A. Results are expressed as percentage of IRS-1 protein amount in control cells and presented as the means ± SEM of four independent experiments. * p < 0.05 control versus IL-1β, ** p <0.05 IL-1β_versus_ IL-6.
Figure 5
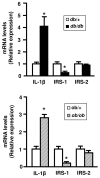
mRNA expression of IL-1β, IRS-1 and IRS-2 in adipose tissue of obese mice. Total RNA were prepared from adipose tissue of lean (white bars) and obese mice (db/db, black bars or ob/ob, hatched bars). The expression level of mRNA were analyzed by real-time quantitative PCR, normalized to the level 36B4 mRNA and expressed in arbritary units, with the control values taken as 1. Results are the means ± SEM of n=6/group. *, Significantly different from lean mice with p < 0.05.
Figure 6
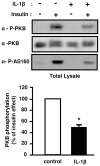
IL-1β decreases insulin-induced PKB and AS160 phosphorylation. 3T3-L1 adipocytes pretreated or not with IL-1β (20 ng/ml) for 48 h were stimulated or not with insulin (0.5 nM) for 5 min. Cells were then lysed. Top, Phosphorylation of PKB and AS160 were monitored by immunoblotting with anti-phospho-PKB (Thr308) (α-P-PKB) or with anti-phospho-AS160 (Thr642) (α-P-AS160) antibodies respectively. Representative autoradiographs are shown. Bottom, PKB phosphorylation was normalized for the total amount of PKB and results are expressed as the means ± SEM of four independent experiments. *, IL-1β effect significant with p < 0.01.
Figure 7
Prolonged IL-1β treatment induces ERK1/2 and p38MAP Kinases phosphorylation. 3T3-L1 adipocytes were treated without or with IL-1β (20 ng/ml) for 48 hours. Proteins from cell lysates were blotted using anti-phospho ERK1/2 (α-P-ERK) or anti-phospho-p38MAPK (α-P-p38) antibodies. The membranes were then stripped and probed using anti-ERK1/2 (α-ERK1/2) or anti-p38 (α-p38) antibodies. Representative immunoblots and means ± SEM of four independent experiments are shown. Results are expressed as fold phosphorylation over basal set to 1 in untreated cells (* p < 0.05).
Figure 8
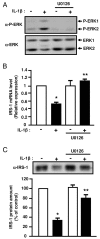
Inhibition of ERK1/2 activity prevents the inhibitory effect of IL-1β on IRS-1 expression. 3T3-L1 adipocytes were treated with vehicle (0.1 % DMSO) or U0126 (10 μM) and without or with IL-1β (20 ng/ml) for 48 hours. A, ERK activation was assessed by immunoblotting with anti-phospho ERK1/2 (α-P-ERK) antibodies. Typical autoradiographs representative of three experiments are shown. B, IRS-1 mRNA level was determined by real-time quantitative PCR. mRNA expression was normalized using 36B4 RNA levels. Results are expressed in arbitrary units, with the control values taken as 1 and are the means ± SEM from three independent experiments. C, IRS-1 amount in cell lysate was determined using anti-IRS1 (α-IRS1) antibodies. Typical autoradiograph is presented and graph shows the means ± SEM of four independent experiments. *, significantly different between control and IL-1β with p < 0.01, ** significantly different between IL-1β and IL-1β + U0126 with p < 0.01.
Figure 9
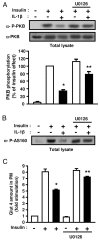
Inhibition of ERK1/2 activity partially prevents the inhibitory effect of IL-1β on insulin-induced PKB and AS160 phosphorylation and on insulin-induced Glut 4 translocation. A, 3T3-L1 adipocytes were treated with vehicle (0.1 % DMSO) or U0126 (10 μM) and without or with IL-1β (20 ng/ml) for 48 hours. Then cells were stimulated or not with insulin for 5 min. Phosphorylation of PKB was monitored by immunoblotting with anti-phospho-PKB (Thr308) (α-P-PKB) antibodies. The membrane was then stripped and probed using anti-PKB (α-PKB) antibodies. Representative autoradiographs are presented, PKB phosphorylation was normalized for the total amount of PKB and graph shows the means ± SEM of four independent experiments. *, significant different between control and IL-1β with p < 0.05, **, significant different between IL-1β and IL-1β + U0126 with p < 0.05. B, Level of AS160 phosphorylation in cell lysates was determined following immunoblotting with anti-phospho-AS160 (Thr642) (α-P-AS160) antibodies in cells treated as described above. A typical autoradiograph representative of four independent experiments is shown. C, 3T3-L1 adipocytes were incubated with vehicle (0.1 % DMSO) or U0126 (10 μM) in absence (empty bars) or presence of IL-1β (20 ng/ml) (black bars) for 48 hours, and then incubated without or with insulin (100 nM) for 20 min. Plasma membrane sheets were prepared and Glut 4 was detected in plasma membrane (PM) as described in Fig. 2. Quantifications of fluorescence level was performed with MetaMorph software as described in “Materials and Methods”. Results are the means ± SEM of three independent experiments. *, significantly different between insulin and IL-1β + insulin with p < 0.01, ** significantly different between IL-1β + insulin and IL-1β + insulin + U0126 with p < 0.01.
Similar articles
- Interleukin-1alpha inhibits insulin signaling with phosphorylating insulin receptor substrate-1 on serine residues in 3T3-L1 adipocytes.
He J, Usui I, Ishizuka K, Kanatani Y, Hiratani K, Iwata M, Bukhari A, Haruta T, Sasaoka T, Kobayashi M. He J, et al. Mol Endocrinol. 2006 Jan;20(1):114-24. doi: 10.1210/me.2005-0107. Epub 2005 Sep 8. Mol Endocrinol. 2006. PMID: 16150868 - Activation of the mammalian target of rapamycin pathway acutely inhibits insulin signaling to Akt and glucose transport in 3T3-L1 and human adipocytes.
Tremblay F, Gagnon A, Veilleux A, Sorisky A, Marette A. Tremblay F, et al. Endocrinology. 2005 Mar;146(3):1328-37. doi: 10.1210/en.2004-0777. Epub 2004 Dec 2. Endocrinology. 2005. PMID: 15576463 - Quercetin differently regulates insulin-mediated glucose transporter 4 translocation under basal and inflammatory conditions in adipocytes.
Xu M, Hu J, Zhao W, Gao X, Jiang C, Liu K, Liu B, Huang F. Xu M, et al. Mol Nutr Food Res. 2014 May;58(5):931-41. doi: 10.1002/mnfr.201300510. Epub 2013 Dec 17. Mol Nutr Food Res. 2014. PMID: 24343960 - [Elucidation of a New Mechanism of Onset of Insulin Resistance: Effects of Statins and Tumor Necrosis Factor-α on Insulin Signal Transduction].
Takaguri A. Takaguri A. Yakugaku Zasshi. 2018;138(11):1329-1334. doi: 10.1248/yakushi.18-00116. Yakugaku Zasshi. 2018. PMID: 30381640 Review. Japanese. - [The expression of the insulin receptor substrate-1 (IRS-1) and analysis of its mechanism].
Shichiri M, Araki E. Shichiri M, et al. Nihon Naibunpi Gakkai Zasshi. 1995 Jan 20;71(1):21-6. doi: 10.1507/endocrine1927.71.1_21. Nihon Naibunpi Gakkai Zasshi. 1995. PMID: 7895862 Review. Japanese.
Cited by
- The Role of Catechins in Regulating Diabetes: An Update Review.
Wen L, Wu D, Tan X, Zhong M, Xing J, Li W, Li D, Cao F. Wen L, et al. Nutrients. 2022 Nov 4;14(21):4681. doi: 10.3390/nu14214681. Nutrients. 2022. PMID: 36364943 Free PMC article. Review. - Innate Immune Cells in the Adipose Tissue in Health and Metabolic Disease.
Michailidou Z, Gomez-Salazar M, Alexaki VI. Michailidou Z, et al. J Innate Immun. 2022;14(1):4-30. doi: 10.1159/000515117. Epub 2021 Apr 13. J Innate Immun. 2022. PMID: 33849008 Free PMC article. Review. - Protective effect of acetylcysteine, histidine, and their combination against diabetes vascular complications in type-2 diabetic rats via reducing NF-kβ pathway signaling.
Mahdavifard S, Nakhjavani M. Mahdavifard S, et al. J Diabetes Metab Disord. 2022 Jul 16;21(2):1233-1240. doi: 10.1007/s40200-021-00967-0. eCollection 2022 Dec. J Diabetes Metab Disord. 2022. PMID: 36404849 Free PMC article. - Interleukin 1 Receptor 1 Knockout and Maternal High Fat Diet Exposure Induces Sex-Specific Effects on Adipose Tissue Adipogenic and Inflammatory Gene Expression in Adult Mouse Offspring.
Bridge-Comer PE, Plows JF, Ramzan F, Patel R, Ganapathy TP, Stanley JL, Vickers MH, Reynolds CM. Bridge-Comer PE, et al. Front Physiol. 2020 Jun 23;11:601. doi: 10.3389/fphys.2020.00601. eCollection 2020. Front Physiol. 2020. PMID: 32655404 Free PMC article.
References
- Zimmet P, Alberti KG, Shaw J. Global and societal implications of the diabetes epidemic. Nature. 2001;414:782–787. - PubMed
- Hauner H. The new concept of adipose tissue function. Physiol Behav. 2004;83:653–658. - PubMed
- Marette A. Molecular mechanisms of inflammation in obesity-linked insulin resistance. Int J Obes Relat Metab Disord. 2003;27:S46–48. - PubMed
Publication types
MeSH terms
Substances
LinkOut - more resources
Full Text Sources
Other Literature Sources
Miscellaneous
