Flexibility and constraint in the nucleosome core landscape of Caenorhabditis elegans chromatin - PubMed (original) (raw)
Flexibility and constraint in the nucleosome core landscape of Caenorhabditis elegans chromatin
Steven M Johnson et al. Genome Res. 2006 Dec.
Abstract
Nucleosome positions within the chromatin landscape are known to serve as a major determinant of DNA accessibility to transcription factors and other interacting components. To delineate nucleosomal patterns in a model genetic organism, Caenorhabditis elegans, we have carried out a genome-wide analysis in which DNA fragments corresponding to nucleosome cores were liberated using an enzyme (micrococcal nuclease) with a strong preference for cleavage in non-nucleosomal regions. Sequence analysis of 284,091 putative nucleosome cores obtained in this manner from a mixed-stage population of C. elegans reveals a combined picture of flexibility and constraint in nucleosome positioning. As has previously been observed in studies of individual loci in diverse biological systems, we observe areas in the genome where nucleosomes can adopt a wide variety of positions in a given region, areas with little or no nucleosome coverage, and areas where nucleosomes reproducibly adopt a specific positional pattern. In addition to illuminating numerous aspects of chromatin structure for C. elegans, this analysis provides a reference from which to begin an investigation of relationships between the nucleosomal pattern, chromosomal architecture, and lineage-based gene activity on a genome-wide scale.
Figures
Figure 1.
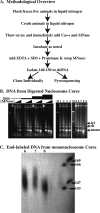
Digestion of C. elegans chromatin in situ to generate core fragments. (A) Overview of the methodology used to isolate nucleosome core DNAs. (B) Electorphoretic gel analysis of micrococcal nuclease-digested chromatin showing the descending-ladder effect with increased micrococcal nuclease digestion. Gel at left shows digestions performed with increasing concentrations of micrococcal nuclease (0, 0.2, 0.8, and 3.2 U/μL) for various amounts of time (2, 6, 18, and 54 min) at 25°C. Lanes 1–9 of the right gel correspond to DNA isolated from the various digestion conditions (digests #1–#9) as described in Table 1. (C) Sequencing gel showing end-labeled mononucleosome core DNA from digestion conditions #6, #7, and #8 in lanes 6, 7, and 8, respectively.
Figure 2.
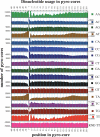
Positional dependence of dinucleotide composition in core and flanking sequences. Graphs show incidence of each dinucleotide at every position in the set of 163,651 unique pyro-core sites. Positions 1–146 show incidence in the presumed core nucleosome, while flanking sequences show the 60 nt preceding and following the pyro-core (positions −60 to −1 and 147–206, respectively). RND TT is a parallel analysis performed on a simulated set of random core segments constructed in silico from C. elegans’ DNA. In each graph, the scale of the ordinate is the same and shows a 5000 core range.
Figure 3.
Positional relationships between neighboring cores. (A) Relative positions of unique/unambiguous pyro-core start (Start-to-Start distances for cores sequenced on the same strand). Histogram shows total pairs of unique/unambiguous nucleosomes with a Start-to-Start distance corresponding to the value on the _x_-axis. A total of 535 pyro-core starts are found at position 1 and are noted on the graph by an arrow. (B) Start-to-End distances for cores sequenced on opposite strands. Histogram shows total pairs of unique/unambiguous nucleosomes with a Start-to-End distance corresponding to the value on the _x_-axis. A filled arrow notes a peak at 146 nt and open arrows note peaks ∼10 and 20 bp shorter, which suggest possible rotational setting preferences.
Figure 4.
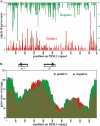
Core positioning and coverage on C. elegans 5S/SL1 DNA. (A) Positive (red) and negative (green) starts of pyro-core sequences represented on a single element of the tandemly repeated Ce5SSL1 gene cluster. (B) Coverage plot of positive (red) and negative (green) pyro-core data for the Ce5SSL1 locus based on an assumption that each sequenced core represents a 146-bp single nucleosome segment.
Figure 5.
Core coverage on C. elegans 18/26S rDNA. (A) Positive (red) and negative (green) starts of pyro-core sequences on a single 7203-bp copy of the 18/26S rDNA gene repeat. (B) Coverage plot of positive (red) and negative (green) pyro-core data for the 18/26S rDNA gene. Between the two coverage plots is a map of the position of the rRNA-coding elements in the rDNA repeat.
Figure 6.
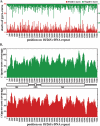
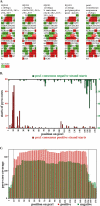
A reiterated genetic element with constrained core positioning. (A) Sequences of four closely matching cores from the original (manually isolated) series of 346 clones. These four clones, isolated from three different chromatin digestion conditions and four separate ligations, correspond to variants of a repeated sequence, designated psx1, present in the C. elegans genome (Bao and Eddy 2002). Individual polymorphisms relative to a consensus version (right) of psx1 are printed in lowercase. Runs of two or more consecutive A’s or T’s are highlighted in green and red, respectively and the sequences are displayed in 10-nt sections. (B) Starts of pyro-core sequences mapping to psx1 copies. Red and green are data from positive and negative starts, respectively. (C) Coverage plot of positive (red) and negative (green) pyro-core data for psx1.
Figure 7.
Evidence for Nucleosome Positioning on psx1. (A) Southern blot probed for psx1. Arrowheads indicate uncut (lanes 1, 3) and ApoI cut (lane 2) cloned control psx1 DNA, while arrows indicate positions of uncut (lanes 6, 10) and ApoI cut (lanes 7, 11) mononucleosome core bands. Lanes 4, 5, 8, and 9 contain nucleosome ladders from micrococcal nuclease-digested chromatin. (B) Agarose gel electrophoresis of unique PCR product bands indicating positioning of micrococcal nuclease termini on psx1. Lanes 1–8 correspond to PCR products from reactions using ligated cores isolated with conditions 1, 3, 4, 5, 6, 7, 8, and 9, respectively (Table 1). “M”, “+”, and “−” indicate lanes containing 100-bp ladder markers (Invitrogen), positive control PCR reaction, and negative control (no template) PCR reactions, respectively. (C) Polyacrylamide gel electrophoresis with lanes 1–4 and + containing end-labeled PCR products from corresponding reactions in lanes 1–4 and + in B. Arrow indicates uniform size of psx1 core products, while open arrowhead indicates 169-nt marker and filled arrowhead indicates control reaction product of 208 nt (∼6 nt larger than the psx1 core products). (D) Sequences of vector-core junctions of psx1 nucleosome cores cloned from PCR reactions shown in lanes 1 and 2 of B. Sequence from the cloning vector is indicated in lowercase, and sequence from psx1 cores is indicated in uppercase letters, respectively. (E) Polyacrylamide gel electrophoresis of psx1 primer extension products from primer AF-SJ-6 with 10 rounds (lane 1) or one round (lane 2) of extension, and from primer AF-SJ-7 with 10 rounds (lane 3) or one round (lane 4) of extension. Curly braces demark positions of three different size ranges of products seen in both sets of primers with the largest size products in each sample being the most abundant as observed in the lanes in which samples underwent only a single round of extension, 2 and 4.
Similar articles
- A high-resolution, nucleosome position map of C. elegans reveals a lack of universal sequence-dictated positioning.
Valouev A, Ichikawa J, Tonthat T, Stuart J, Ranade S, Peckham H, Zeng K, Malek JA, Costa G, McKernan K, Sidow A, Fire A, Johnson SM. Valouev A, et al. Genome Res. 2008 Jul;18(7):1051-63. doi: 10.1101/gr.076463.108. Epub 2008 May 13. Genome Res. 2008. PMID: 18477713 Free PMC article. - Chromatin structure of the yeast URA3 gene at high resolution provides insight into structure and positioning of nucleosomes in the chromosomal context.
Tanaka S, Livingstone-Zatchej M, Thoma F. Tanaka S, et al. J Mol Biol. 1996 Apr 19;257(5):919-34. doi: 10.1006/jmbi.1996.0212. J Mol Biol. 1996. PMID: 8632475 - Nucleosome fragility is associated with future transcriptional response to developmental cues and stress in C. elegans.
Jeffers TE, Lieb JD. Jeffers TE, et al. Genome Res. 2017 Jan;27(1):75-86. doi: 10.1101/gr.208173.116. Epub 2016 Nov 14. Genome Res. 2017. PMID: 27979995 Free PMC article. - Review fifteen years of search for strong nucleosomes.
Trifonov EN, Nibhani R. Trifonov EN, et al. Biopolymers. 2015 Aug;103(8):432-7. doi: 10.1002/bip.22604. Biopolymers. 2015. PMID: 25546738 Review. - Control of nucleosome positions by DNA sequence and remodeling machines.
Schnitzler GR. Schnitzler GR. Cell Biochem Biophys. 2008;51(2-3):67-80. doi: 10.1007/s12013-008-9015-6. Epub 2008 Jun 10. Cell Biochem Biophys. 2008. PMID: 18543113 Review.
Cited by
- Chromosome Structural Mechanics Dictates the Local Spreading of Epigenetic Marks.
Sandholtz SH, Kannan D, Beltran BG, Spakowitz AJ. Sandholtz SH, et al. Biophys J. 2020 Oct 20;119(8):1630-1639. doi: 10.1016/j.bpj.2020.08.039. Epub 2020 Sep 12. Biophys J. 2020. PMID: 33010237 Free PMC article. - Sequence periodicity in nucleosomal DNA and intrinsic curvature.
Nair TM. Nair TM. BMC Struct Biol. 2010 May 17;10 Suppl 1(Suppl 1):S8. doi: 10.1186/1472-6807-10-S1-S8. BMC Struct Biol. 2010. PMID: 20487515 Free PMC article. - Comparative analysis of H2A.Z nucleosome organization in the human and yeast genomes.
Tolstorukov MY, Kharchenko PV, Goldman JA, Kingston RE, Park PJ. Tolstorukov MY, et al. Genome Res. 2009 Jun;19(6):967-77. doi: 10.1101/gr.084830.108. Epub 2009 Feb 26. Genome Res. 2009. PMID: 19246569 Free PMC article. - Genome-wide nucleosome mapping of Plasmodium falciparum reveals histone-rich coding and histone-poor intergenic regions and chromatin remodeling of core and subtelomeric genes.
Westenberger SJ, Cui L, Dharia N, Winzeler E, Cui L. Westenberger SJ, et al. BMC Genomics. 2009 Dec 16;10:610. doi: 10.1186/1471-2164-10-610. BMC Genomics. 2009. PMID: 20015349 Free PMC article. - Nucleosome positioning signals in genomic DNA.
Peckham HE, Thurman RE, Fu Y, Stamatoyannopoulos JA, Noble WS, Struhl K, Weng Z. Peckham HE, et al. Genome Res. 2007 Aug;17(8):1170-7. doi: 10.1101/gr.6101007. Epub 2007 Jul 9. Genome Res. 2007. PMID: 17620451 Free PMC article.
References
- Axel R. Cleavage of DNA in nuclei and chromatin with staphylococcal nuclease. Biochemistry. 1975;14:2921–2925. - PubMed
- Baer B.W., Kornberg R.D., Kornberg R.D. Random location of nucleosomes on genes for 5 S rRNA. J. Biol. Chem. 1979;254:9678–9681. - PubMed
- Brower-Toland B.D., Smith C.L., Yeh R.C., Lis J.T., Peterson C.L., Wang M.D., Smith C.L., Yeh R.C., Lis J.T., Peterson C.L., Wang M.D., Yeh R.C., Lis J.T., Peterson C.L., Wang M.D., Lis J.T., Peterson C.L., Wang M.D., Peterson C.L., Wang M.D., Wang M.D. Mechanical disruption of individual nucleosomes reveals a reversible multistage release of DNA. Proc. Natl. Acad. Sci. 2002;99:1960–1965. - PMC - PubMed
- Buttinelli M., Panetta G., Rhodes D., Travers A., Panetta G., Rhodes D., Travers A., Rhodes D., Travers A., Travers A. The role of histone H1 in chromatin condensation and transcriptional repression. Genetica. 1999;106:117–124. - PubMed
Publication types
MeSH terms
Substances
Grants and funding
- T32 GM007231/GM/NIGMS NIH HHS/United States
- HG00044/HG/NHGRI NIH HHS/United States
- T32 CA009151/CA/NCI NIH HHS/United States
- R01-GM37706/GM/NIGMS NIH HHS/United States
- T32 HG000044/HG/NHGRI NIH HHS/United States
- T32GM07231/GM/NIGMS NIH HHS/United States
- K22 HG000044/HG/NHGRI NIH HHS/United States
- R01 GM037706/GM/NIGMS NIH HHS/United States
LinkOut - more resources
Full Text Sources
Other Literature Sources
Research Materials
