Time scales of membrane fusion revealed by direct imaging of vesicle fusion with high temporal resolution - PubMed (original) (raw)
Time scales of membrane fusion revealed by direct imaging of vesicle fusion with high temporal resolution
Christopher K Haluska et al. Proc Natl Acad Sci U S A. 2006.
Abstract
Membrane fusion is a vital process of life involved, for example, in cellular secretion via exocytosis, signaling between nerve cells, and virus infection. In both the life sciences and bioengineering, controlled membrane fusion has many possible applications, such as drug delivery, gene transfer, chemical microreactors, or synthesis of nanomaterials. Until now, the fusion dynamics has been elusive because direct observations have been limited to time scales that exceed several milliseconds. Here, the fusion of giant lipid vesicles is induced in a controlled manner and monitored with a temporal resolution of 50 micros. Two different fusion protocols are used that are based on synthetic fusogenic molecules and electroporation. For both protocols, the opening of the fusion necks is very fast, with an average expansion velocity of centimeters per second. This velocity indicates that the initial formation of a single fusion neck can be completed in a few hundred nanoseconds.
Conflict of interest statement
The authors declare no conflict of interest.
Figures
Fig. 1.
Several series of snapshots for the fusion of two vesicles. (a) Fusion of two functionalized vesicles (of radii 25.4 and 16.6 μm) held by micropipettes (only the right pipette tip is visible on the snapshots). A third pipette (bottom right corner) is used to inject a small volume (few tens of nanoliters) of 50 μM solution of EuCl3. The first image corresponding to the starting time t = 0 represents the last snapshot before the adhesion zone of the vesicles undergoes detectable changes. (b) The behavior of a single vesicle (first image) and a vesicle couple (remaining images) when exposed to a dc pulse in the absence of salt. The amplitude of the dc pulse was 90 V (1.8 kV/cm), and its duration was 150 μs. (c) Behavior of a single vesicle (first image) and a vesicle couple (remaining images) in the presence of 1 mM NaCl in the exterior solution (the vesicle radii are 29.0 and 26.5 μm). In this case, the amplitude of the dc pulse was 150 V (3 kV/cm), and its duration was 150 μs. The polarity of the electrodes is indicated with a plus (+) or a minus (−) sign. The arrows in the first images indicate porated parts of the membrane, which lead to the leakage of enclosed liquid. For both b and c, the starting time t = 0 corresponds to the beginning of the dc pulse. In the last two snapshots of the sequence (b), the fused vesicles contain an array of internal vesicles (bright spots) as indicated by the arrows. The image acquisition rate was 20,000 fps. For more details, see Movies 1–4.
Fig. 2.
Molecular mechanisms of membrane fusion. (a) The fusion process as observed on the micrometer scale (compare Fig. 1). (b and c) The cartoons in b and c are hypothetical molecular rearrangements for ligand-mediated fusion (b) and electrofusion (c), which we might see if we were able to zoom into the contact zone with molecular resolution.
Fig. 3.
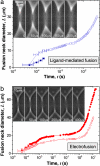
Opening of the fusion neck. The fusion neck diameter, L, as a function of time, t, is plotted semilogarithmically for ligand-mediated fusion (a) and electofusion (b). The different symbols correspond to different vesicle couples (see Methods for details). The data set corresponding to the full squares in a represents a fusion event in which one of the two fusing vesicle ruptures before it completely merges with the second vesicle, which is why we show only data corresponding to the early stage of the fusion (before the membrane ruptures). The first dynamic regime that is characterized by rapid expansion of the fusion neck extends up to ≈300 μs for ligand-mediated fusion and up to ≈1 ms for electrofusion (compare with Fig. 5). (Insets) Snapshots with a magnified section of the fusion neck covering the time period from 0 to 400 μs.
Fig. 4.
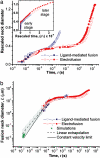
Comparative data analysis of ligand-mediated fusion and electrofusion. (a) Rescaled fusion neck diameter L/(_R_1 + _R_2) as a function of time t is plotted semilogarithmically. Note that the data sets collapse onto a single curve between 50 μs and 3 ms. (Inset) The rescaled fusion neck diameter as a function of the rescaled time t/τ (see text for definition of τ). The normalized data collapse onto a single curve for the later stages of the expansion of the fusion neck corresponding to t/τ > 103. (b) Double logarithmic plot of the fusion neck diameter L as a function of time t. The solid line for t < 50 μs corresponds to an average expansion velocity of 5 cm/s as estimated from the first frames for the four fusion processes. Linear extrapolation of all data with 50 < t < 300 μs leads to the dashed line that corresponds to an expansion velocity of 4 cm/s. The shaded stripe around this line indicates the fitting error as estimated by least-squares fitting. For comparison, simulation data from ref. are also included. The latter data describe the opening of a single fusion neck for a small vesicle with a diameter of 28 nm and are consistent with the experimental data obtained here for the fusion neck expansion of giant vesicles.
Similar articles
- High cholesterol obviates a prolonged hemifusion intermediate in fast SNARE-mediated membrane fusion.
Kreutzberger AJ, Kiessling V, Tamm LK. Kreutzberger AJ, et al. Biophys J. 2015 Jul 21;109(2):319-29. doi: 10.1016/j.bpj.2015.06.022. Biophys J. 2015. PMID: 26200867 Free PMC article. - Conflicting views on the membrane fusion machinery and the fusion pore.
Sørensen JB. Sørensen JB. Annu Rev Cell Dev Biol. 2009;25:513-37. doi: 10.1146/annurev.cellbio.24.110707.175239. Annu Rev Cell Dev Biol. 2009. PMID: 19575641 Review. - Currents through the fusion pore that forms during exocytosis of a secretory vesicle.
Breckenridge LJ, Almers W. Breckenridge LJ, et al. Nature. 1987 Aug 27-Sep 2;328(6133):814-7. doi: 10.1038/328814a0. Nature. 1987. PMID: 2442614 - Osmotic swelling of vesicles: its role in the fusion of vesicles with planar phospholipid bilayer membranes and its possible role in exocytosis.
Finkelstein A, Zimmerberg J, Cohen FS. Finkelstein A, et al. Annu Rev Physiol. 1986;48:163-74. doi: 10.1146/annurev.ph.48.030186.001115. Annu Rev Physiol. 1986. PMID: 2423021 Review. - Real-time membrane fusion of giant polymer vesicles.
Zhou Y, Yan D. Zhou Y, et al. J Am Chem Soc. 2005 Aug 3;127(30):10468-9. doi: 10.1021/ja0505696. J Am Chem Soc. 2005. PMID: 16045316
Cited by
- Direct observation of intermediate states in model membrane fusion.
Keidel A, Bartsch TF, Florin EL. Keidel A, et al. Sci Rep. 2016 Mar 31;6:23691. doi: 10.1038/srep23691. Sci Rep. 2016. PMID: 27029285 Free PMC article. - The Influence of Vesicle Shape and Medium Conductivity on Possible Electrofusion under a Pulsed Electric Field.
Liu L, Mao Z, Zhang J, Liu N, Liu QH. Liu L, et al. PLoS One. 2016 Jul 8;11(7):e0158739. doi: 10.1371/journal.pone.0158739. eCollection 2016. PLoS One. 2016. PMID: 27391692 Free PMC article. - Area Increase and Budding in Giant Vesicles Triggered by Light: Behind the Scene.
Georgiev VN, Grafmüller A, Bléger D, Hecht S, Kunstmann S, Barbirz S, Lipowsky R, Dimova R. Georgiev VN, et al. Adv Sci (Weinh). 2018 Jun 5;5(8):1800432. doi: 10.1002/advs.201800432. eCollection 2018 Aug. Adv Sci (Weinh). 2018. PMID: 30128249 Free PMC article. - The role of the membrane confinement in the surface area regulation of cells.
Staykova M, Stone HA. Staykova M, et al. Commun Integr Biol. 2011 Sep;4(5):616-8. doi: 10.4161/cib.4.5.16854. Epub 2011 Sep 1. Commun Integr Biol. 2011. PMID: 22046479 Free PMC article. - Fusing Artificial Cell Compartments and Lipid Domains Using Optical Traps: A Tool to Modulate Membrane Composition and Phase Behaviour.
Vivek A, Bolognesi G, Elani Y. Vivek A, et al. Micromachines (Basel). 2020 Apr 7;11(4):388. doi: 10.3390/mi11040388. Micromachines (Basel). 2020. PMID: 32272670 Free PMC article.
References
- Fischer A, Franco A, Oberholzer T. Chem Biol Chem. 2002;3:409–417. - PubMed
- Lipowsky R, Dimova R. J Phys Condens Matter. 2003;15:S31–S45.
- Baumgart T, Hess ST, Webb WW. Nature. 2003;425:821–824. - PubMed
Publication types
MeSH terms
Substances
LinkOut - more resources
Full Text Sources


