Isolation, characterization, and genetic complementation of a cellular mutant resistant to retroviral infection - PubMed (original) (raw)
Isolation, characterization, and genetic complementation of a cellular mutant resistant to retroviral infection
Sumit Agarwal et al. Proc Natl Acad Sci U S A. 2006.
Abstract
By using a genetic screen, we have isolated a mammalian cell line that is resistant to infection by retroviruses that are derived from the murine leukemia virus, human immunodeficiency virus type 1, and feline immunodeficiency virus. We demonstrate that the cell line is genetically recessive for the resistance, and hence it is lacking a factor enabling infection by retroviruses. The block to infection is early in the life cycle, at the poorly understood uncoating stage. We implicate the proteasome at uncoating by completely rescuing the resistant phenotype with the proteasomal inhibitor MG-132. We further report on the complementation cloning of a gene (MRI, modulator of retrovirus infection) that can also act to reverse the inhibition of infection in the mutant cell line. These data implicate a role for the proteasome during uncoating, and they suggest that MRI is a regulator of this activity. Finally, we reconcile our findings and other published data to suggest a model for the involvement of the proteasome in the early phase of the retroviral life cycle.
Conflict of interest statement
The authors declare no conflict of interest.
Figures
Fig. 1.
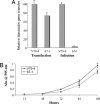
Comparison of gene transfer and growth. (A) V79-4 or mutant 67-1 cells were either infected or transfected with the HIV-1 vector transferring the blasticidin-resistance gene. The data are expressed relative to the gene transfer efficiency of WT cells. (B) Growth rate of V79-4 and 67-1 cells.
Fig. 2.
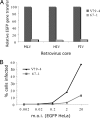
Resistance of mutant cells to infection. (A) V79-4 and 67-1 cells were infected with EGFP-marked MLV-, HIV-1-, and FIV-based vectors. The virus was produced in the presence of all accessory factors, and infection was measured by using flow cytometry to detect EGFP expression. These representative data are expressed relative to infection of the WT cells. (B) Infection of 67-1 cells is not readily saturable. V79-4 and 67-1 cells were infected with HIV-1 viral vectors transducing EGFP with increasing (by 1 log) multiplicities of infection (moi), and the extent of infection was measured by flow cytometry. Note that the titer of the EGFP virus was determined on HeLa cells.
Fig. 3.
Block to infection is recessive and not at the level of entry. (A) V79-4 and 67-1 cells were labeled with fluorescent membrane dyes [Oregon green or Vybrant DID (blue)], and V79-4 and 67-1 cells were either fused with PEG or self-fused. Cells were infected with an HIV-1 viral vector transducing dsRED, and the extent of infection was determined by flow cytometry. The extent of infection is expressed as the proportion of cells (percent, left; y axis) that are green, blue, and red compared with cells that are green and blue only. The extent of expression (also reflecting multiple infection events) of dsRED is quantified as the geometrical mean of the red fluorescence from the infected population (right; y axis). (B) V79-4 and 67-1 cells were infected with an HIV-1 vector transducing luciferase pseudotyped with the amphotropic MLV envelope. Data are expressed relative to the infection of WT cells.
Fig. 4.
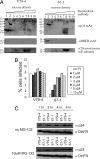
Uncoating assay and effect of infection with proteasome inhibitor. (A) Sucrose equilibrium density gradients analysis of HIV-1 capsid (p24) distribution 6 h after infection. Cellular cytoplamic extracts were fractionated on a 20–70% sucrose gradient, and fractions were collected from the top. Fractions were analyzed by immunoblotting, using a mouse anti-p24 Ab (αp24 mAb), mouse anti-dihydrofolate reductase Ab (αDHFR mAb), or rabbit anti-20S proteasome α/β subunits. (B) V79-4 and 67-1 cells were infected with an HIV-1 vector transducing EGFP in the absence or presence of increasing concentrations of the proteasome inhibitor (PI) MG-132. The extent of infection was quantified as the fractions of cells expressing EGFP by flow cytometry. (C) Capsids were stabilized by MG-132 in 67-1 cells. V79-4 and 67-1 cells were preincubated with 10 μM MG-132 for 4 h and then infected with an HIV-1 vector. At various times after infection (1, 2, 4, and 6 h) cell extracts were prepared, and p24 levels were assessed by immunoblot analysis (αp24). Equivalence in extract loading was checked by reprobing the blots with an Ab to dihydrofolate reductase (αDHFR).
Fig. 5.
Rescue of infection in 67-1 cells. (A) V79-4 and 67-1 cells cotransfected with a puromycin-resistance plasmid and candidate clone expression vectors were selected with puromycin, and the pool of surviving clones was tested for infection with a luciferase-marked HIV-1 virus. Data are expressed as relative light units (RLUs) compared with WT V79-4 cells. (B) Individual clones of puromycin-resistant clones were isolated and tested for infection with EGFP-marked MLV and HIV-1 viruses. Data are expressed as the percent of cells infected relative to V79-4 cells.
Fig. 6.
Sequence and localization of MRI. (A) Sequence comparisons of MRI protein from human, mouse, rat, hamster, and chicken. (B) Cellular localization of epitope-tagged MRI protein in hamster WT V79-4, mutant 67-1, human A498, and MRC-5 cells.
Fig. 7.
Decreased MRI expression impacts infection. (A) Identification of effective shRNA targeting sequences to MRI. FLAG epitope-tagged MRI was cotransfected (+ FLAG-MRI) with an EGFP expression vector and various shRNA expression vectors (shScram random sequence; sh623, sh760, and sh353 targeting MRI; or empty vector) into human HEK 293 cells. MRI expression was assessed 48 h later by immunoblot analysis with an anti-FLAG Ab (αFLAG). Transfection efficiency was monitored by using an anti-EGFP Ab (αEGFP). (B) Human U87 cells expressing MRI shRNA are resistant to infection by HIV-1 vectors. ShRNA targeting a random sequence (shScram), the firefly luciferase gene (shFF), and targeting MRI (sh353 and sh623) were transduced into human U87 cells by using retroviral vectors. ShRNA-expressing cells were then infected with an HIV-1 vector transducing luciferase, and infection was monitored 48 h later. Data [relative light units (RLU)/μg of protein] are represented relative to the shScram sequence set at 100%. Standard deviations from the mean of triplicates are represented by the error bars.
Similar articles
- Construction and use of retroviral vectors encoding the toxic gene barnase.
Agarwal S, Nikolai B, Yamaguchi T, Lech P, Somia NV. Agarwal S, et al. Mol Ther. 2006 Oct;14(4):555-63. doi: 10.1016/j.ymthe.2006.03.025. Epub 2006 Jun 30. Mol Ther. 2006. PMID: 16814610 - MLV-derived retroviral vectors selective for CD4-expressing cells and resistant to neutralization by sera from HIV-infected patients.
Stitz J, Steidl S, Merget-Millitzer H, König R, Müller P, Nocken F, Engelstädter M, Bobkova M, Schmitt I, Kurth R, Buchholz CJ, Cichutek K. Stitz J, et al. Virology. 2000 Feb 15;267(2):229-36. doi: 10.1006/viro.1999.0121. Virology. 2000. PMID: 10662618 - Post-entry restriction of retroviral infections.
Towers GJ, Goff SP. Towers GJ, et al. AIDS Rev. 2003 Jul-Sep;5(3):156-64. AIDS Rev. 2003. PMID: 14598564 Review. - Restriction factors: a defense against retroviral infection.
Bieniasz PD. Bieniasz PD. Trends Microbiol. 2003 Jun;11(6):286-91. doi: 10.1016/s0966-842x(03)00123-9. Trends Microbiol. 2003. PMID: 12823946 Review.
Cited by
- A tractable method for simultaneous modifications to the head and tail of bacteriophage lambda and its application to enhancing phage-mediated gene delivery.
Zanghi CN, Sapinoro R, Bradel-Tretheway B, Dewhurst S. Zanghi CN, et al. Nucleic Acids Res. 2007;35(8):e59. doi: 10.1093/nar/gkm146. Epub 2007 Mar 28. Nucleic Acids Res. 2007. PMID: 17392341 Free PMC article. - Regulation of DNA repair pathway choice in S and G2 phases by the NHEJ inhibitor CYREN.
Arnoult N, Correia A, Ma J, Merlo A, Garcia-Gomez S, Maric M, Tognetti M, Benner CW, Boulton SJ, Saghatelian A, Karlseder J. Arnoult N, et al. Nature. 2017 Sep 20;549(7673):548-552. doi: 10.1038/nature24023. Nature. 2017. PMID: 28959974 Free PMC article. - Recurrent mutations in multiple components of the cohesin complex in myeloid neoplasms.
Kon A, Shih LY, Minamino M, Sanada M, Shiraishi Y, Nagata Y, Yoshida K, Okuno Y, Bando M, Nakato R, Ishikawa S, Sato-Otsubo A, Nagae G, Nishimoto A, Haferlach C, Nowak D, Sato Y, Alpermann T, Nagasaki M, Shimamura T, Tanaka H, Chiba K, Yamamoto R, Yamaguchi T, Otsu M, Obara N, Sakata-Yanagimoto M, Nakamaki T, Ishiyama K, Nolte F, Hofmann WK, Miyawaki S, Chiba S, Mori H, Nakauchi H, Koeffler HP, Aburatani H, Haferlach T, Shirahige K, Miyano S, Ogawa S. Kon A, et al. Nat Genet. 2013 Oct;45(10):1232-7. doi: 10.1038/ng.2731. Epub 2013 Aug 18. Nat Genet. 2013. PMID: 23955599 - Biochemistry and Protein Interactions of the CYREN Microprotein.
Xie L, Bowman ME, Louie GV, Zhang C, Ardejani MS, Huang X, Chu Q, Donaldson CJ, Vaughan JM, Shan H, Powers ET, Kelly JW, Lyumkis D, Noel JP, Saghatelian A. Xie L, et al. Biochemistry. 2023 Nov 7;62(21):3050-3060. doi: 10.1021/acs.biochem.3c00397. Epub 2023 Oct 9. Biochemistry. 2023. PMID: 37813856 Free PMC article. - Characterization of resistance to rhabdovirus and retrovirus infection in a human myeloid cell line.
Boso G, Somia NV. Boso G, et al. PLoS One. 2015 Mar 26;10(3):e0121455. doi: 10.1371/journal.pone.0121455. eCollection 2015. PLoS One. 2015. PMID: 25811758 Free PMC article.
References
- Best S, Le Tissier P, Towers G, Stoye JP. Nature. 1996;382:826–829. - PubMed
- Kozak CA, Chakraborti A. Virology. 1996;225:300–305. - PubMed
- Goff SP. Mol Cell. 2004;16:849–859. - PubMed
Publication types
MeSH terms
Substances
LinkOut - more resources
Full Text Sources
Molecular Biology Databases


